As I periodically contemplate the abysmal state of geographical education and knowledge in the United States, I can’t help comparing it to the situation that existed in earlier times. Geography had long been an essential component of basic education, but it was largely eliminated in the U.S. in misbegotten post-WWII educational “reforms.” We now face a situation in which even college-educated Americans are hard-pressed to identify more than a few countries on a world political map.
In Victorian Britain, in stark contrast, a basic understanding of world geography was essential for every educated person. Young ladies as well as young gentlemen were expected to have a good deal of familiarity with the map of the world. They could even feel shame if they lacked it.
This is, I realize, a strong claim that demands justification. In this post, I offer only one piece of evidence. But it is, I think, a strong one. It comes from a passage in Charles Dickens’ novel Bleak House. Here we find the character Caddy Jellyby, a middle-class teenager who is forced to work as her mother’s secretary, comparing herself unfavorably to Ada Clare, a young lady she has just met. Caddy is speaking to another new acquaintance, the saintly Esther Summerson, the main protagonist and partial narrator of the novel.
“An orphan. Ain’t she? But she knows a quantity, I suppose? Can dance, and play music, and sing? She can talk French, I suppose, and do geography, and globes, and needlework, and everything? … I can’t, … I can’t do anything hardly, except write. I’m always writing for Ma.” (Bleak House, Chapter 4, “Telescopic Philanthropy.” Emphasis added)
Caddy Jellyby on the Importance of Geography
Bleak House is often regarded as Dickens’ greatest novel, and for good reason. In a 2022 essay in Atlantic, Charlie Tyson argues if Dickens had died in 1850, after David Copperfield but before Bleak House, he would be remembered mainly as a sentimental storyteller. In Bleak House, Tyson argues, Dickens crafted something entirely new: a multi-plotted “novel of networks” that captured the complexity of industrial and metropolitan life in London, and that combined the social-problem novel, the educational novel (bildungsroman), and the mystery novel. Tyson also claims that the book anticipated Kafka’s vision of a nightmarish bureaucracy and even much later postmodern experiments in fiction writing.
I hesitate to disagree with Tyson’s interpretation, as I am no expert in English literature. I would argue, however, that Bleak House is not primarily a novel of London and urban life, as it is far more comprehensive than that. It equally encompasses rural life, ranging from the opulent manor at Chesney Wold in Lincolnshire, to the park and gamekeeper’s lodge at the same estate, to a miserable brickmaker’s cottage in the countryside, roughly 20 miles north of London. Bleak House itself – which is anything but bleak – is near the same cottage, in a bucolic area outside of St. Albans in Hertfordshire.
In short, I agree that Bleak House is a magnificent portrayal of urban life, focused on the Holborn neighborhood of central London, particularly Chancery Lane and Lincoln’s Inn. (Not coincidentally, Dickens lived there as a young man.) But it is equally a story about rural life; without Chesney Wold and the rustic lands around St. Albans, it would be half the novel that it is, both literally and figuratively. It would also need a different title. Krook’s Rag and Bottle Shop, perhaps?
Main Location in Dickens’ Bleak House map
Main Urban Locations in Dickens’ Novel Bleak House map
Historical Map of the Main Urban Location in Dickens’ Bleak House
Source of the illustration-detail of Caddy Jellyby and Esther Summerson: https://victorianweb.org/art/illustration/phiz/bleakhouse/3.html
(Note: For those interested, I recommend both reading Bleak House and listening to it as an audiobook. It is available for free at LibriVox. I also recommend the version read by Mil Nicholson. In my humble opinion, Dickens is the greatest novelist, and Mil Nicholson is greatest reader of novels. It is a real art, and she does it superbly.)
As discussed in recent GeoCurrents posts, the northern and central parts of Colombia’s Andes region – the core area of the country – voted heavily for the narrowly victorious rightwing candidate, Abelardo do le Espriella, in the 2026 election. Several important left-voting exceptions were also noted: Bogotá with its industrial “suburbs,” and indigenous-majority districts. Another cluster of left-leaning municipalities located in northeastern Tolima Department (see the map below) calls for further investigation. As it turns out, some interesting historical and geographical factors are at play here.
2026 Colombian Election Tolima map
Let us begin with the historically important municipality of Honda. Although situated well within Colombia’s high-elevation Andes region, Honda is actually lowland town (elevation 751 feet/229 meters), as it is located in the deep valley of the Magdelena River. Although it currently has only some 25,000 residents, Honda was once one of Colombia’s most important transportation hubs. Before the early twentieth century, Bogotá had no road or railroad connections to Colombia’s Caribbean ports. Instead, people and goods had to travel up the Magdelena River to its head of navigation at Honda. Honda was connected to Bogotá by a mule road that dates to the mid-1500s. According to Wikipedia, the town’s “golden age” was between 1850 and 1910, when “all the imported goods and articles arrived in Bogotá through the port of Honda.” It has been speculated – at least by AI – that Honda’s historical connections with left-leaning Caribbean ports, particularly Barranquilla, are linked to its current leftwing voting pattern.
The old road from the river port to the capital city, the Camino Real Honda–Santa Fe de Bogotá, traversed some rough landscapes while gaining 7,923 feet/2,415 meters of elevation from its beginning to its end. The local topography and elevation differences can be seen the map posted below, which was cobbled together from two excellent Wikipedia physical maps. The route of the road is visible in the next figure posted below, which is based on a detail taken from a map of the late 19th century.
Honda and Bogota Physical map
Historical Road from Honda to Bogota map
In 1801, the great German geographer Alexander von Humboldt took an arduous canoe trip to Honda and then proceeded overland to Bogotá, where he stayed for two months. In Bogotá, von Humboldt worked with the prominent botanist and mathematician José Celestino Mutis, a key figure in the Spanish-American Enlightenment. I tried to access Humbolt’s assessments of Honda from his personal diaries, using AI as a crutch. I learned that “These emphasize practical travel difficulties, the surrounding vegetation, commerce on the river, and scientific measurements more than architectural or social details of the town.” Humboldt did note, however, that the inhabitants of Honda were “disfigured by goiters,” presumably due to iodine deficiency.
Northern Tolima, Colombia and Left-Voting Municipalities Map
Most of the other leftwing-voting municipalities of northeastern Tolima Department are located on the Magdelena River south of Honda and hence have somewhat similar historical and geographical conditions (see the map above). The exception is Líbano, a plateau town of some 36,000 inhabitants. I was initially surprised by Líbano’s leftwing election returns, as it is a coffee-growing district that was established in the mid-1800s by settlers from Antioquia Department. Today, the plateau zone of Antioquia and Colombia’s coffee-growing areas more generally are noted for their political conservatism. This is a familiar story to me, as I studied in graduate school under James Parsons, author of Antioqueño Colonization in Western Colombia (1968, University of California Press). As stated at the beginning of the book:
The temperate uplands of the northernmost Andes of western Colombia are the home of the energetic and thrifty Antioqueños, the self-styled “Yankees of South America.” They are shrewd, aggressive individualists whose extraordinary colonizing genius and vigor have made them the dominant and most clearly defined population element of the republic. Their long and effective geographical isolation in the interior highlands of Colombia is reflected in a determined conservatism and a marked cultural particularism. Being Antioqueño means more to them than being Colombian.
James Parsons Antioqueno Colonization in Colombia map
My perplexity was, however, relieved by further investigation. Líbano, it turns out, has a fascinating and unusual political history, one that still heavily influences its political orientation. As AI (Grok) performed extremely well in this instance, I will simply paste in its interpretation rather than put it in my own words:
Líbano (Tolima) has a distinctive historical tradition of radical Liberalism, early socialist/communist organizing, and lasting progressive political networks that set it apart from many nearby highland coffee-growing municipalities, which more often lean conservative or right-leaning. This explains why it backed Iván Cepeda (Pacto Histórico) in the 2026 presidential runoff while much of the surrounding area supported Abelardo de la Espriella.
Líbano was founded in the mid-19th century by Liberal settlers from Antioquia/Viejo Caldas (led by figures such as Isidro Parra). It developed as a prosperous coffee municipality in the northern cordillera of Tolima and became a known Liberal stronghold (“the Red City”). Liberal governments encouraged its growth as a party redoubt.
In July 1929, roughly 300–armed artisans, peasants, and workers (linked to the Partido Socialista Revolucionario and inspired by the Russian Revolution) briefly seized the town and nearby areas in what historians describe as one of the earliest organized communist/socialist insurrections in Latin America. It was quickly suppressed, but the episode embedded a durable local identity of agrarian radicalism, labor organizing, and left-leaning dissent. [Former] President Petro has publicly referenced the “Líbano bolchevique.” This memory continued to shape local politics and even influenced later guerrilla fronts.
During mid-20th-century partisan violence, Líbano remained a predominantly Liberal area that experienced guerrilla self-defense activity and later leftist organizing. It produced or sheltered progressive figures and retained networks tied to agrarian struggles, coffee-worker issues, and opposition to conservative dominance.
The influential Jaramillo political family (notably Alfonso Jaramillo Salazar, a longtime Liberal leader, physician, governor, congressman, and health minister, plus relatives such as Guillermo Alfonso Jaramillo, a Petro-era minister, and Mauricio Jaramillo) built strong local clientelist and progressive ties. In recent cycles, “jaramillismo” and Liberal factions in the area aligned with or voted for Pacto Histórico candidates rather than traditional or right-wing options. Local coverage treated Líbano as a key northern Tolima bastion for Cepeda/Pacto Histórico.
The three northwestern coastal departments of Peru, Tumbes, Piura, and Lambayeque all voted solidly for the victorious rightwing candidate, Keiko Fujimori, in the 2026 election, giving her, respectively, 64.4%, 57%, and 58.9% of their votes. By Peruvian standards, these three departments are roughly average in terms of social and economic development (see the maps in the previous post). All three have agriculturally oriented economies, and all have long favored conservative, market-oriented policies.
One distinctive socio-cultural feature of northwestern Peru is its relatively large proportion of Afro-Peruvians. Black Peruvians constitute 11.5 percent of the population of Tumbes, 8.9 percent of the population of Piura, and 8.4 percent of the population of Lambayeque, the highest figures in the country. One might expect Afro-Peruvians to favor leftwing candidates, which is certainly the case in Colombia regarding Afro-Colombians (as can be seen on the final two maps posted below). Unfortunately, racial electoral data in Peru is not available. It has been noted, however, that Afro-Peruvian issues received little attention in the 2026 platforms of all Peruvian political parties. If Black voters in Peru did favor the leftwing candidate, Roberto Sánchez, then the dominant mestizo population of the northwest must have voted even more strongly for Fujimori than the total departmental tallies would indicate.
Comparing an elevation map of Peru with a map of its 2026 presidential election shows that most highland area voted for the defeated leftwing candidate Roberto Sánchez. Tension between the people of the Andean plateaus and those of the economically dominant coastal region and its metropolitan center of Lima are deeply engrained, giving the highlands a distinctly leftwing orientation. But the same maps also reveal a few exceptions to this rule. The most interesting one is the province of Oxapampa in the eastern part of the department of Pasco.
Highlands of Peru in the 2026 Presidential Election
Pasco is as a sparsely populated department, with fewer than 300,000 inhabitants, that is rich in mineral resources. Its capital city, the mining center of Cerro de Pasco, sits an elevation of 14,210 feet (4,330 meters), making it one of the loftiest cities in the world. Pasco’s eastern province, Oxapampa, is situated on the eastern side of the Andean divide, with elevations ranging from 17,400 feet (5,300 meters) at the highest peak (Huaguruncho) to 660 feet (200 meters) in the Amazonian lowlands of the east. Most of Oxapampa’s roughly 100,000 inhabitants live the mid-level elevation zone in the western part of the province, which is the area that supported the rightwing candidate Keiko Fujimoiri in the Peruvian presidential election of 2026.
Oxapampa’s conservative voting behavior may be linked to its settlement by German immigrants in the mid 1880s. The unusual history of the province is outlined in the Wikipedia article on the village of Pozuzo:
In the 1850s, Peruvian President Ramon Casilla proposed building a railroad from the capital city of Lima across the Andes Mountains, and onward to the navigable rivers of the Amazon Basin. Part of the plan (the only part realized) was to import German and Austrian Catholics to settle on the eastern slopes of the Andes and in the tropical rainforests of the Amazon region, then populated only by indigenous people. In 1855, the Peruvian leader signed an agreement with German traveler Kuno Damian von Schütz-Holzhausen to recruit 10,000 Germans and Austrians to emigrate to Peru and establish colonies on the eastern flanks of the Andes. The Peruvian government agreed to pay the cost of the passage from Europe to Peru of the emigrants and the cost of transporting them overland to Pozuzo and other areas designated for their settlement. …
On arrival [in Peru], Schütz found that the Peruvian government had done little to prepare for the arrival of the colonists and their transportation to Pozuzo. The colonists undertook a difficult journey on foot and mule to reach Pozuzo, starting from the port of Huacho, reaching an elevation of more than 4,700 metres (15,400 ft) crossing the Andes, to Cerro de Pasco, onward to Acobamba (Ambo) and, constructing the road en route, to Pozuzo. The town was established in 1859 by 172 of the original 302 colonists who had departed Europe together. Many had deserted en route or had died or been killed during the journey.
The population of the German settlers rapidly increased in the early decades, but their descendants eventually intermarried extensively with other Peruvians. Their culture gradually became more Peruvian than German. Some aspects of German culture, however, have persisted, helping make Oxapampa an important tourism destination in recent years. An AI assessment of the current ethnic composition of the province runs as follows:
In the town of Oxapampa, the German cultural presence is significant but not dominant. Many residents have partial German/Austrian ancestry, reflected in surnames (e.g., Schmidt, Müller), Tyrolean-style architecture, festivals, food (e.g., local beers), and some traditions. However, extensive intermarriage with mestizo, indigenous (e.g., Yanesha), and other groups means “full” or dominant German descent is limited. Nearby Pozuzo (founded by the original colonists) has a stronger enclave feel, with estimates of ~1,000 people of more direct Austro-German descent in a district of ~5,000–9,000.
Not surprisingly, language and ethnicity were major factors in the 2026 Peruvian presidential election. As can be seen in the maps posted below, the defeated leftwing candidate Roberto Sánchez had his best results in areas where Spanish is not the majority mother tongue. In Peru’s southern highlands, Quechua remains the most common first language, especially in rural areas. Sánchez’s campaign highlighted the concerns of the historically marginalized indigenous peoples. In particular, he promised to transform Peru into a “plurinational” republic, recognizing the distinct national identities of non-Spanish-speaking communities and abandoning the idea of the country as a “nation state” defined around a singular political identity. The move from “nationalism” to “plurinationalism” has already been institutionalized in Bolivia and Ecuador, and has been proposed as well in Chile, Argentina, Guatemala, and Costa Rica. Although popular in indigenous communities and among the left more generally, plurinationalism is opposed by the right and is not popular in many of Peru’s Spanish-speaking communities.
Spanish Languages & Peru’s 2026 Election Map
Quechua Languages & Peru’s 2026 Election Map
Indigenous languages are also spoken across the lowlands of eastern Peru, but most have small numbers of speakers who are not well integrated into the national society. The Spanish language is dominant in most of this sparsely inhabited but rapidly growing region. As the map of lowland indigenous languages posted below shows, only two provinces in eastern Peru have clear indigenous majorities: Purus (in Ucayali Department) and Condorcanqui (in Amazonas Department). Interestingly, these two provinces had completely different voting patterns in the 2026 election. Condorcanqui overwhelmingly supported Sánchez, whereas Purus strongly supported Fujimori. The vote-count in Purus, however, is almost certainly not representative of the province’s indigenous character. Only some 3,200 people live in Purus, and its indigenous communities are small, scattered, relatively isolated, and divided among several different language groups. It seems likely that the votes cast in this province came mostly from the economically dominant Spanish-speaking population. It is a different story in the more populous province of Condorcanqui, which has almost 50,000 inhabitants. Most of them are members of the Awajún (or Aguaruna) ethnic group, who number some 70,000 and have achieved a significant degree of political organization. As noted in their Wikipedia article:
In the later half of the 20th century, the arrival of Protestant and Jesuit missionaries, the building of roads, and the construction of an oil pipeline created substantial tension between the Aguaruna people, poor agricultural colonists, state agencies, and corporations. In response to new threats to their way of life the Aguaruna began to organize a political and social response to defend themselves on the basis of principles consistent with other rights of indigenous peoples.
Amazonian Languages & Peru’s 2026 Election Map
Given such political organization among the Awajún/Aguaruna people, it is not surprising that Condorcanqui overwhelming supported the leftwing candidate Roberto Sánchez in the 2026 Peruvian presidential election.
Although almost all non-Spanish-speaking areas of Peru supported Roberto Sánchez in the election, it does not follow that Spanish-speaking areas correspondingly voted for Keiko Fujimoiri. The coastal strip of southern Peru and the large inland city of Arequipa in the same area, for example, are strongly Spanish speaking, yet gave Sánchez solid support.
Arequipa, Spanish Languages & Peru’s 2026 Election Map
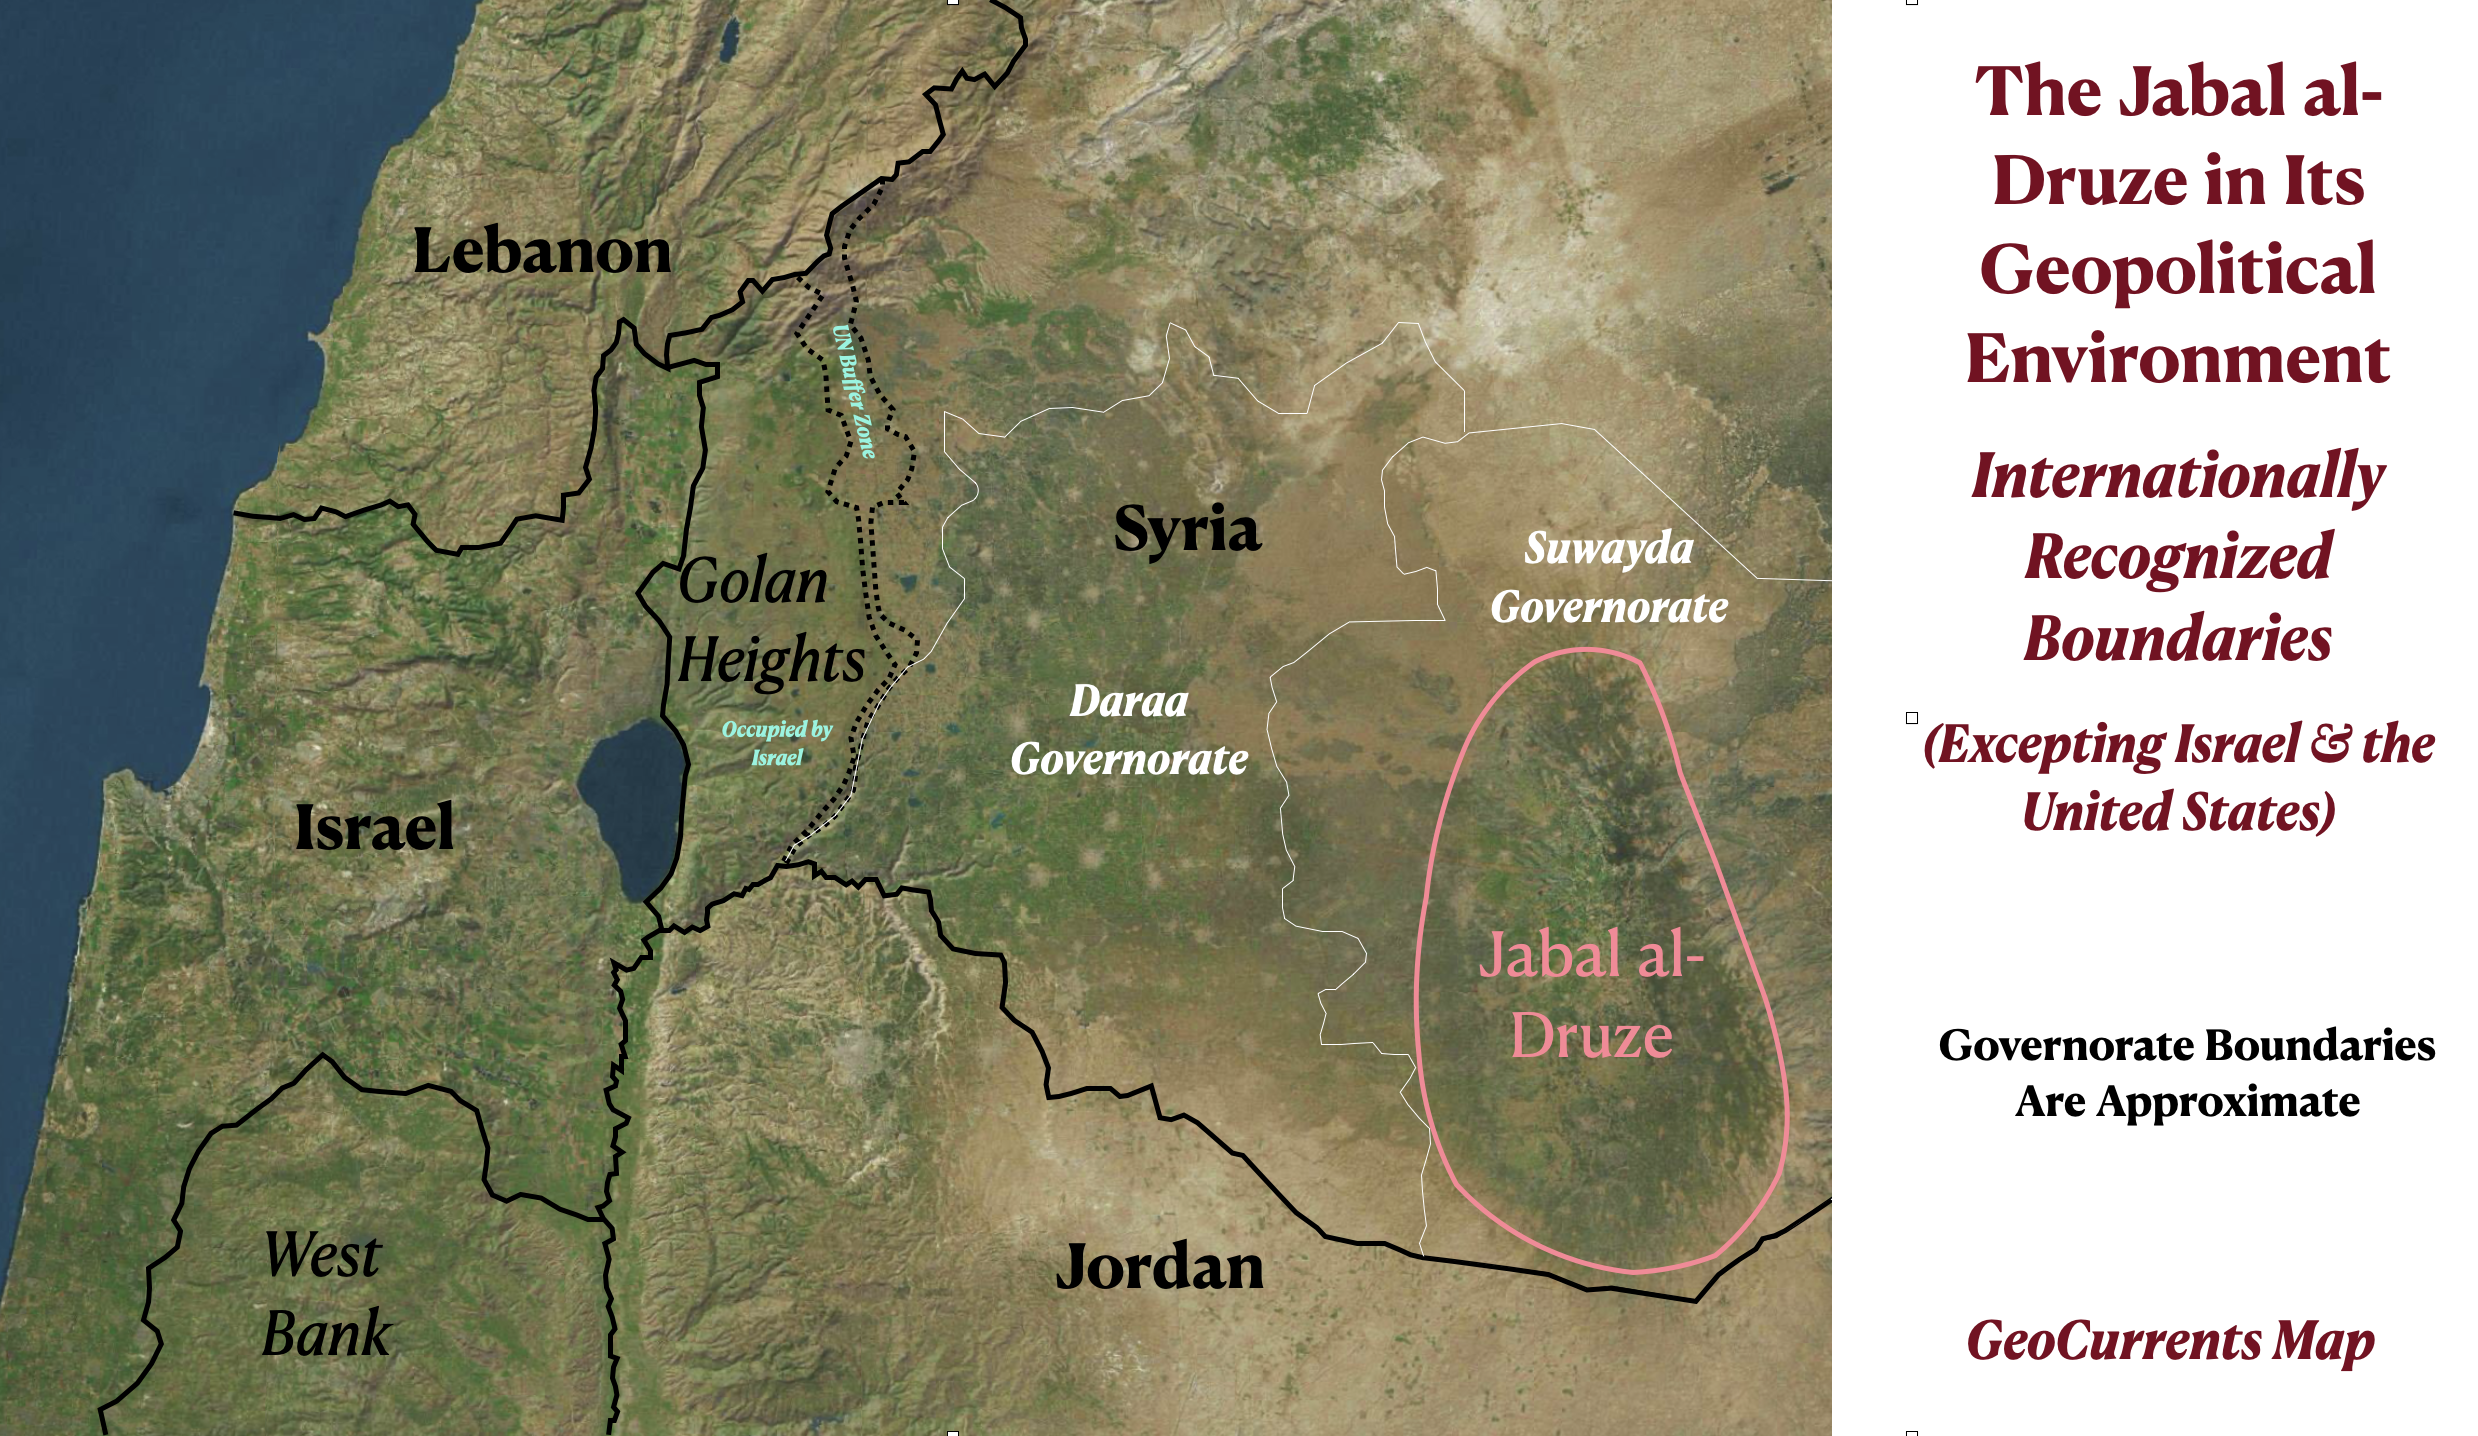
Since the fall of Syria’s Assad Regime in December 2024, I have been wondering what would become of the Druze people and the areas in which they are the majority population. Particularly important is the Jabal al-Druze, or “Mountain of the Druze,” which is clearly visible on satellite images of southern Syria (see the two maps posted below, with different international borders). Syria’s new president, Ahmed Hussein al-Sharaa, now portrays himself as a moderate and has vowed to protect the Druze and other minority groups. But al-Sharaa, who recently went under the nom du guerre Abu Mohammad al-Julani, was once a member of al-Qaeda and was a founder of the Al-Nusra Front, another hard-core Islamist group deeply hostile to the non-Muslim Druze.
Jabal al-Druze in Its Geopolitical Environment, Satellite Imager Map 1
Jabal al-Druze in Its Geopolitical Environment, Satellite Imager Map 2
Not surprisingly, the situation in the Jabal al-Druze remains tense. On March 20, 2026, Israel bombed Syrian military sites in the vicinity, claiming that it did so to protect the Druze. Roughly 150,000 Druze live in Israel, where their men serve in the national defense forces (IDF]); according to Wikipedia, “Druze men have one of the highest enlistment rates in the country, at over 80%.” After the attack on Syrian military assets, Israel’s defense minister said that “We will not allow the Syrian regime to exploit our war against Iran and Hezbollah to harm the Druze. If necessary, we will attack with greater force.”
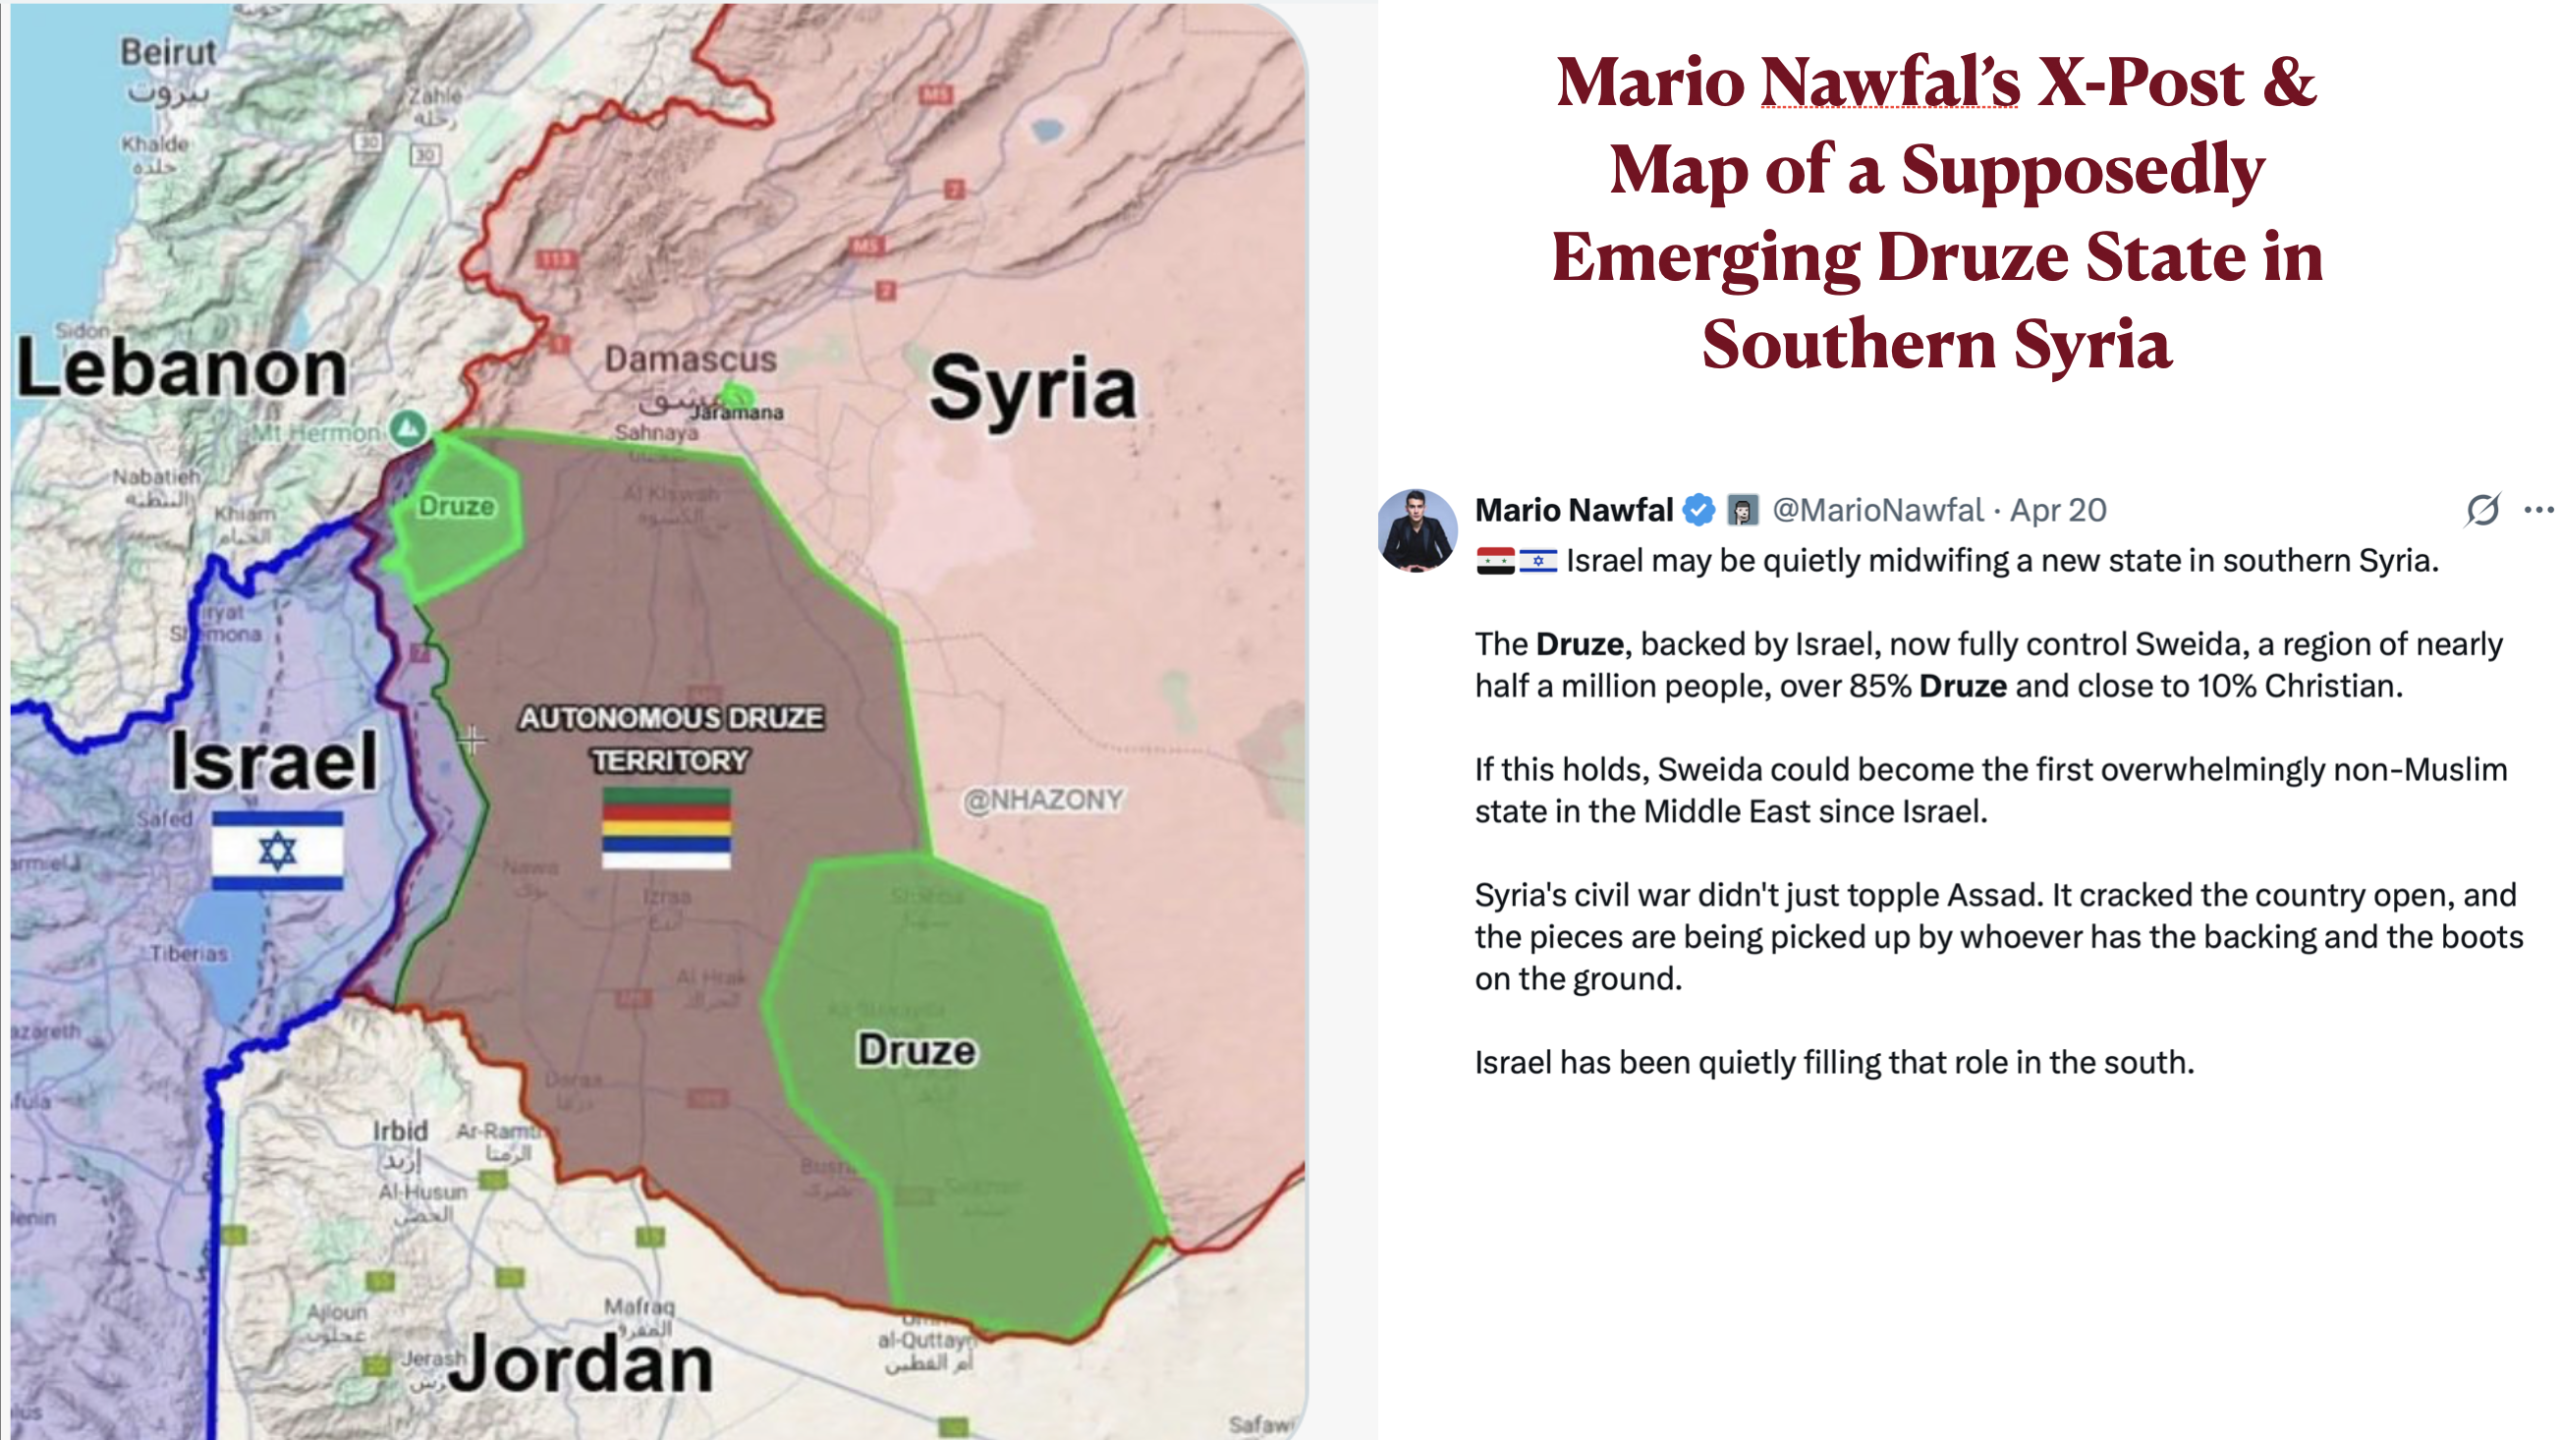
Shortly after these events, Mario Nawfal, an influential but controversial Lebanese-Australian entrepreneur and political commentator based in the UAE, made some strong claims on X (“Twitter”) about an emerging Druze state being “midwifed” by Israel in Syria’s Suwayda Governorate, which includes the Jabal al-Druze (see the figure posted below). I find Nawfal’s comments intriguing yet exaggerated. But I view that map that he used to illustrate his post as highly misleading.
Mario Nawfal’s Map of an Emerging Druze State in Syria
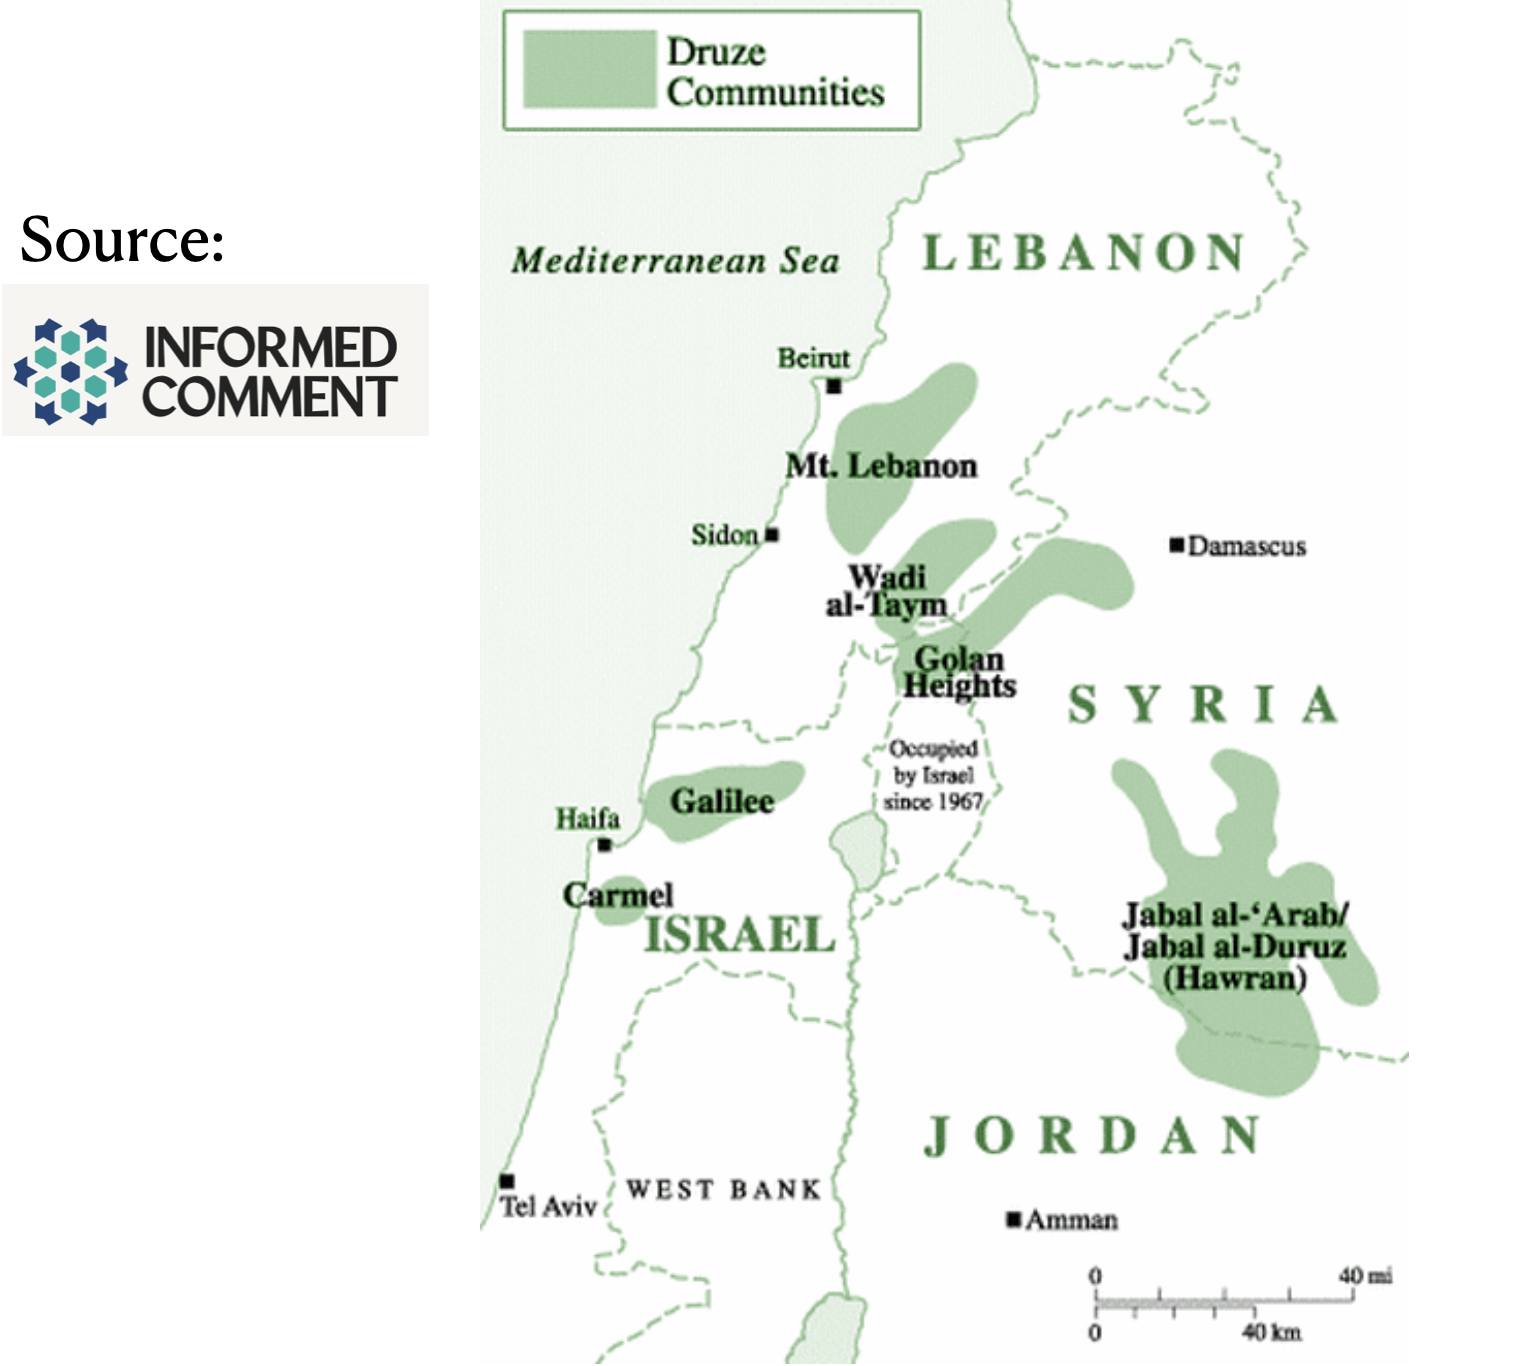
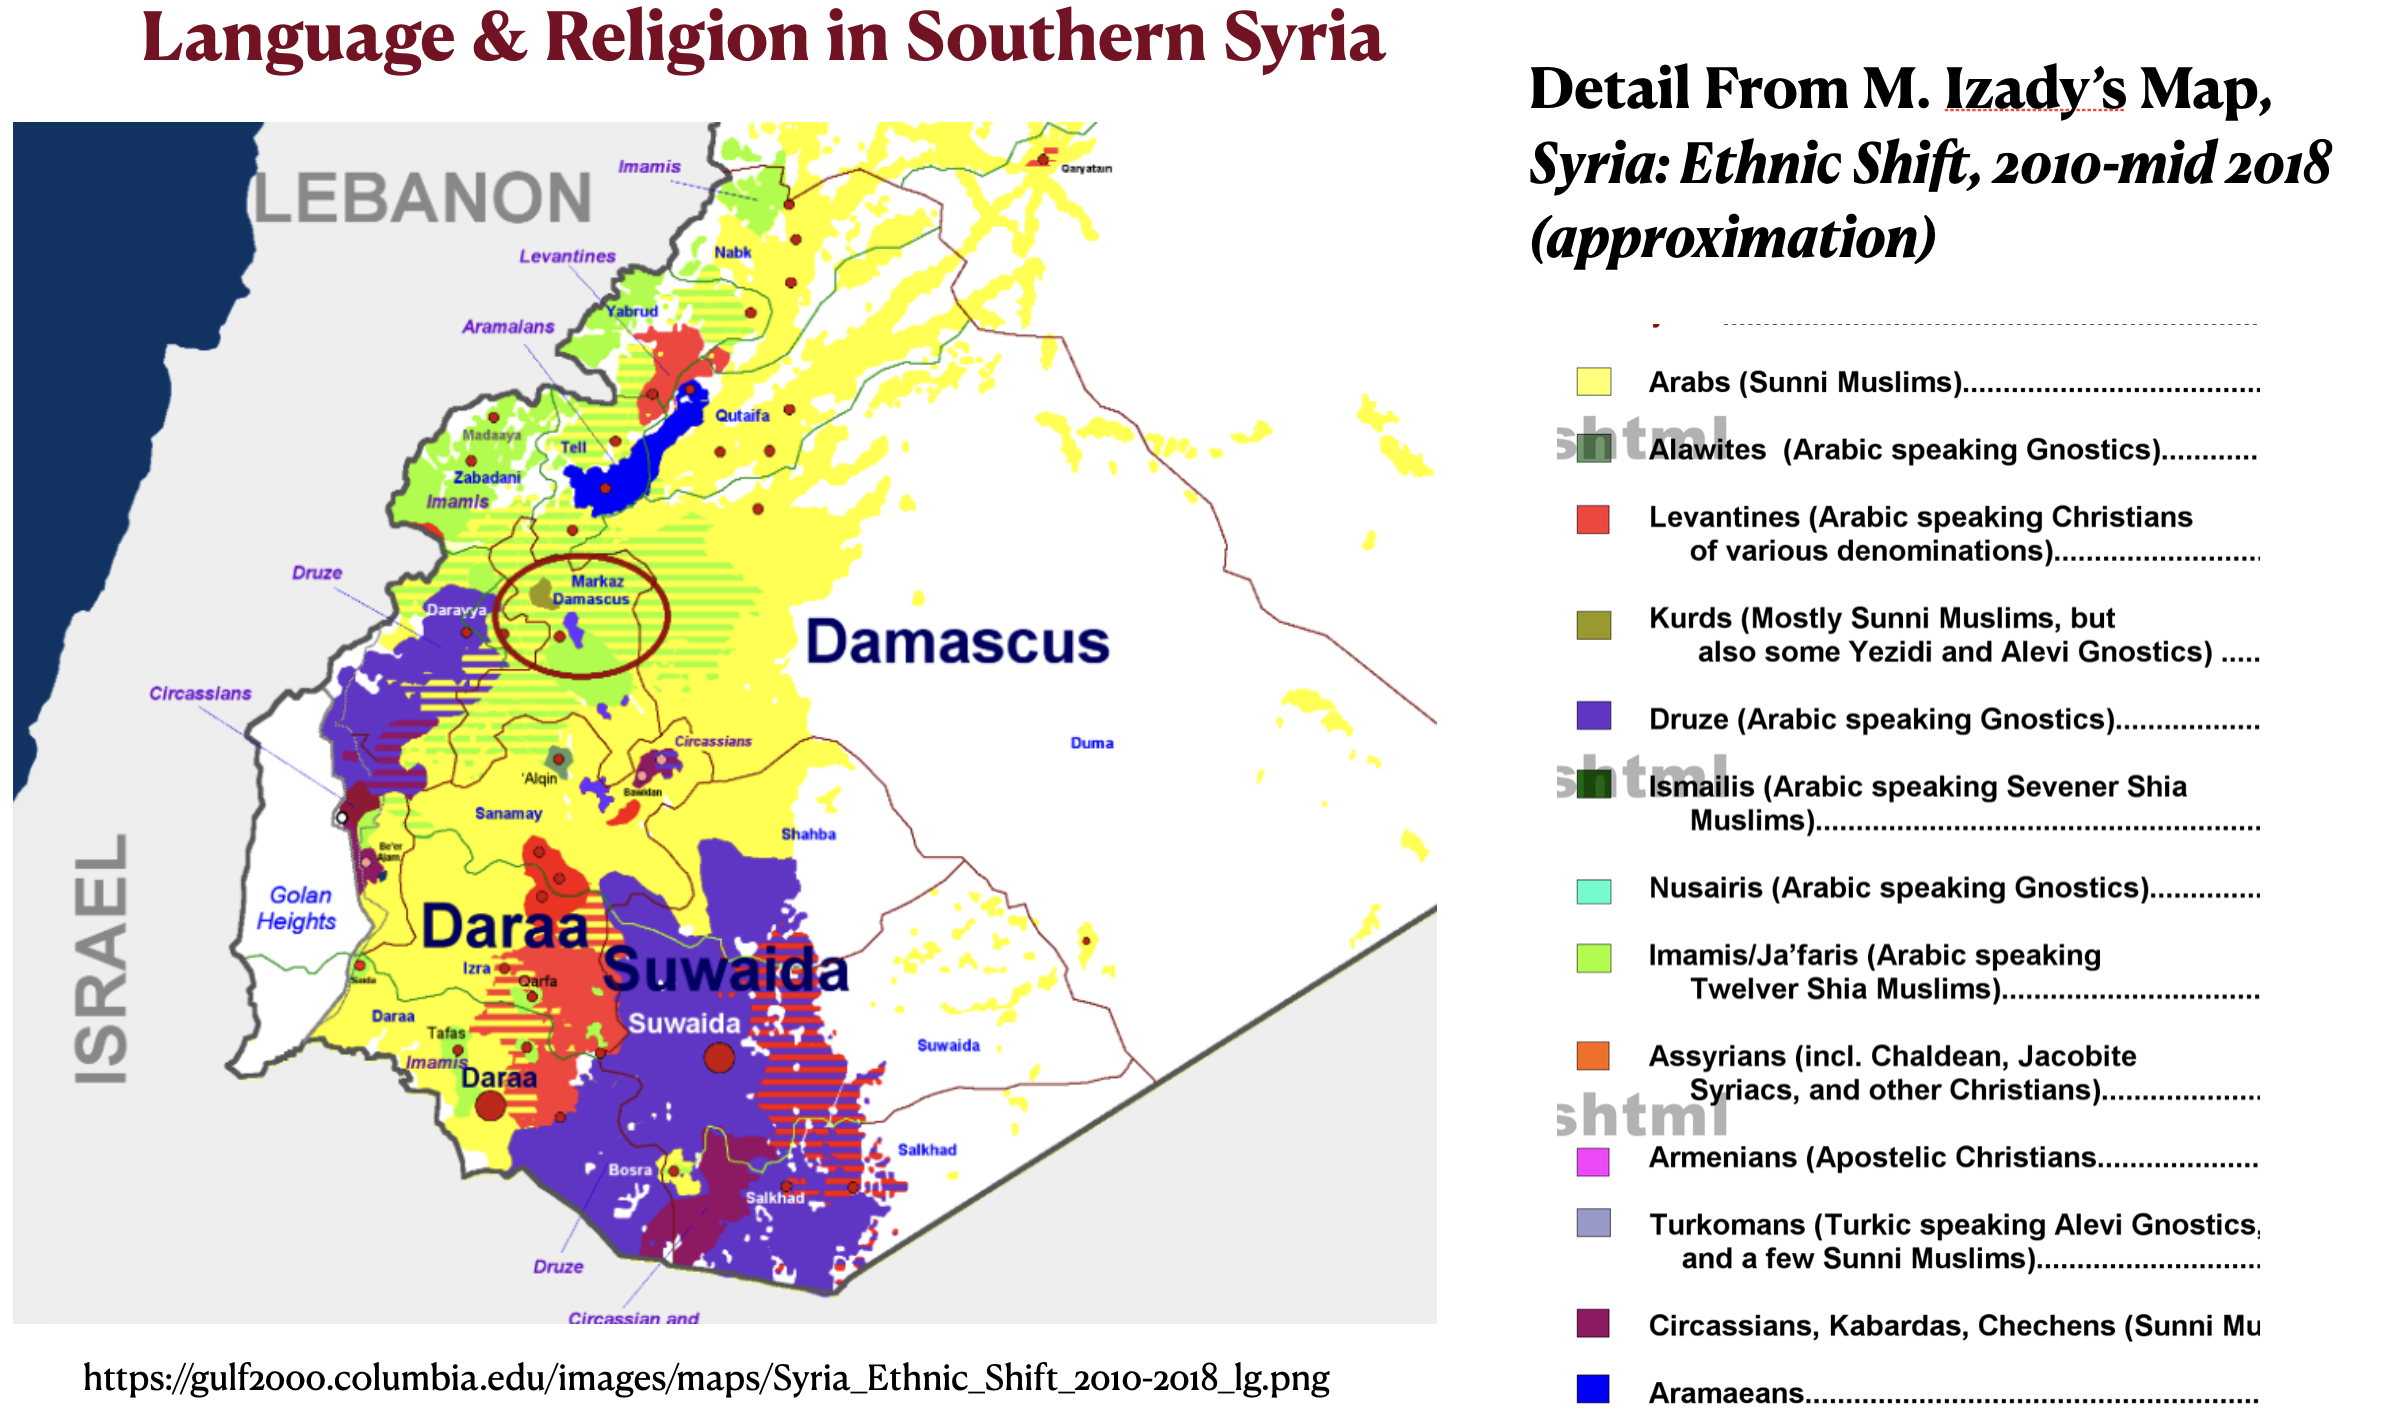
Nawfal’s map does a decent job of showing two sizable areas with Druze majorities in southern Syria, which he depicts in green (compare his map with a map of Druze distribution posted on the blog Informed Comment, which is reproduced below). The problem lies in his depiction of the area between these two Druze-majority zones. He has colored this area brown but has given it a green outline while placing within it the label “Autonomous Druze Territory” along with a depiction of the Druze flag. Such mapping implies that any emergent Druze state or autonomous territory would include this area. This prospect is not only highly unlikely, but any attempt to create it would almost certainly result in a deadly and protracted conflict. The brown area on Nawfal’s map includes Syria’s Daraa Governorate, which is overwhelmingly Sunni Muslim (around 97 percent by most estimates) and hostile to both Druze and Israeli geopolitical designs. It also has more than twice the population of the Druze-dominated Suwayda Governorate (over one million as opposed to fewer than 500,000 inhabitants). (Note that M. Izady’s detailed map of language and religion in the area shows a sizable Christian area in eastern Daraa. But Christian numbers here were small to begin with and have dropped significantly in recent years.)
Druze Distribution Map from Informed Comment
M. Izady Map of Language and Religion in Southern Syria
In my opinion, the situation of the Druze in both Syria and Lebanon deserves far more attention than it has been receiving. As if often case, the more intense conflicts in the larger region tend to crowd out important but less heated geopolitical struggles.
As explained in the previous GeoCurrents post, the historical region of Khwarazm, located south of the (former) Aral Sea in Central Asia, was a major intellectual hub in late-ancient and medieval times, producing two of the world’s greatest scholars, al-Biruni and al-Khwarizmi. It also supported several powerful states based on its extensive irrigated agriculture, the rich fisheries of the Aral Sea (or Lake of Khwarazm), and long-distance trade. Yet it is now a largely ignored region characterized by a lagging economy, political tension, and extreme environmental degradation. Khwarazm’s current troubles will be explored in a later GeoCurrents post. This essay explores a more basic issue: where exactly is historical Khwarazm situated in the geopolitical framework of today? The answer to this simple question is more complicated that it might seem.
The Khwarazm region is clearly visible on satellite images, where it appears as green splotch of verdant farms set amid brown deserts and the desiccated salt-beds of the former Aral Sea. But how closely does this current oasis-like area correspond to historical Khwarazm? A map of the Khwarazm’s ancient fortresses seemingly indicates that the historical region’s core territory lay in the southeastern portion of the modern irrigated zone. A map of the cities of Khwarazm in the early Islamic period, however, shows that Khwarazm during this period largely corresponds to the modern agricultural area.
Khwarazm Today, Satellite Map
Fortresses of Ancient Khwarazm map
Cities of Early Medieval Khwarazm map
I had long thought that historical Khwarazm was largely coterminous with the modern “Autonomous Republic of Karakalpakstan” in Uzbekistan. The Wikipedia article on the region, after all, tells us that the territory of Karakalpakstan“covers the classical land of Khwarazm, which in classical Persian literature was known as Kāt.” In actuality, Karakalpakstan covers less than half of this “classical land” (see the maps below). Much of Khwarazm is in what is now the Daşoguz region (province) of northern Turkmenistan, and a large portion is in Uzbekistan’s Khorazm (or Xorazm) region (province) (see the second figure posted below). Because of this political division, it is not easy to find the current population of historical Khwarazm. To do so, one must add the figures from Karakalpakstan (2,015,000), Uzbekistan’s Khorazm region (1,958,000), and Turkmenistan’s Daşoguz region (1,550,000), which yields a total population of around five and a half million people. Given the relatively small size of its cities, modern Khwarazm has a high rural population density, which can easily be appreciated by closely examining satellite images of the region.
Karakalpakstan and the Former Aral Sea map
Historical Khwarazm and Divided Khwarazm Today, map
Politically Divided Khwarazm map
It must be asked why such a coherent area would be geopolitically divided, split between two countries and, in one of those countries, between a supposedly autonomous republic and a regular region (province). The answer is found in the internal geopolitics of the Soviet Union. From 1511 to 1920, Khwarazm formed the Khanate of Khiva, ruled by Uzbek Khans. In 1873, this state was stripped of much of its territory and reduced to the status of a Russian protectorate. But it remained largely independent, as indicated by many maps made at the time (see below). In 1920, three years after the Russian Revolution, Khwarazm was transformed into the Khorezm People’s Soviet Republic, a first-order division of the Soviet Union. Three years later its status was downgraded to that of a “Socialist Soviet Republic” (SSR) and the next year it was dissolved, its land divided between the Uzbek and Turkmen SSRs and the new “Karakalpak Autonomous Oblast.” In 1936, the “autonomous oblast” was joined to the Uzbek SSR, which eventually became Uzbekistan. According to Wikipedia, “the history of the short-lived [Khorezm People’s Soviet Republic] remains murky and the way its government functioned is not largely clear.” It also unsurprisingly informs us that “its officials fervently opposed the delimitation plans of the Khorezmian Republic (which had to be carried out under Stalin’s orders) but in the end they were forced to concede.”
Khanate of Khiva Depicted as Independent in the Early 1900s map
Khanate of Khiva on 1853 Map
The ostensible reason for the Soviet division of Khwarazm was the ethnolinguistic differentiation of the region. According to often-abused Leninist principles, each major ethnic group or nationality in the Soviet Union was supposed to have some measure of cultural and political autonomy. But by the early twentieth century, Khwarazm was no longer culturally homogenous and was, as a result, divided. This is a complicated story, however, that needs some unpacking.
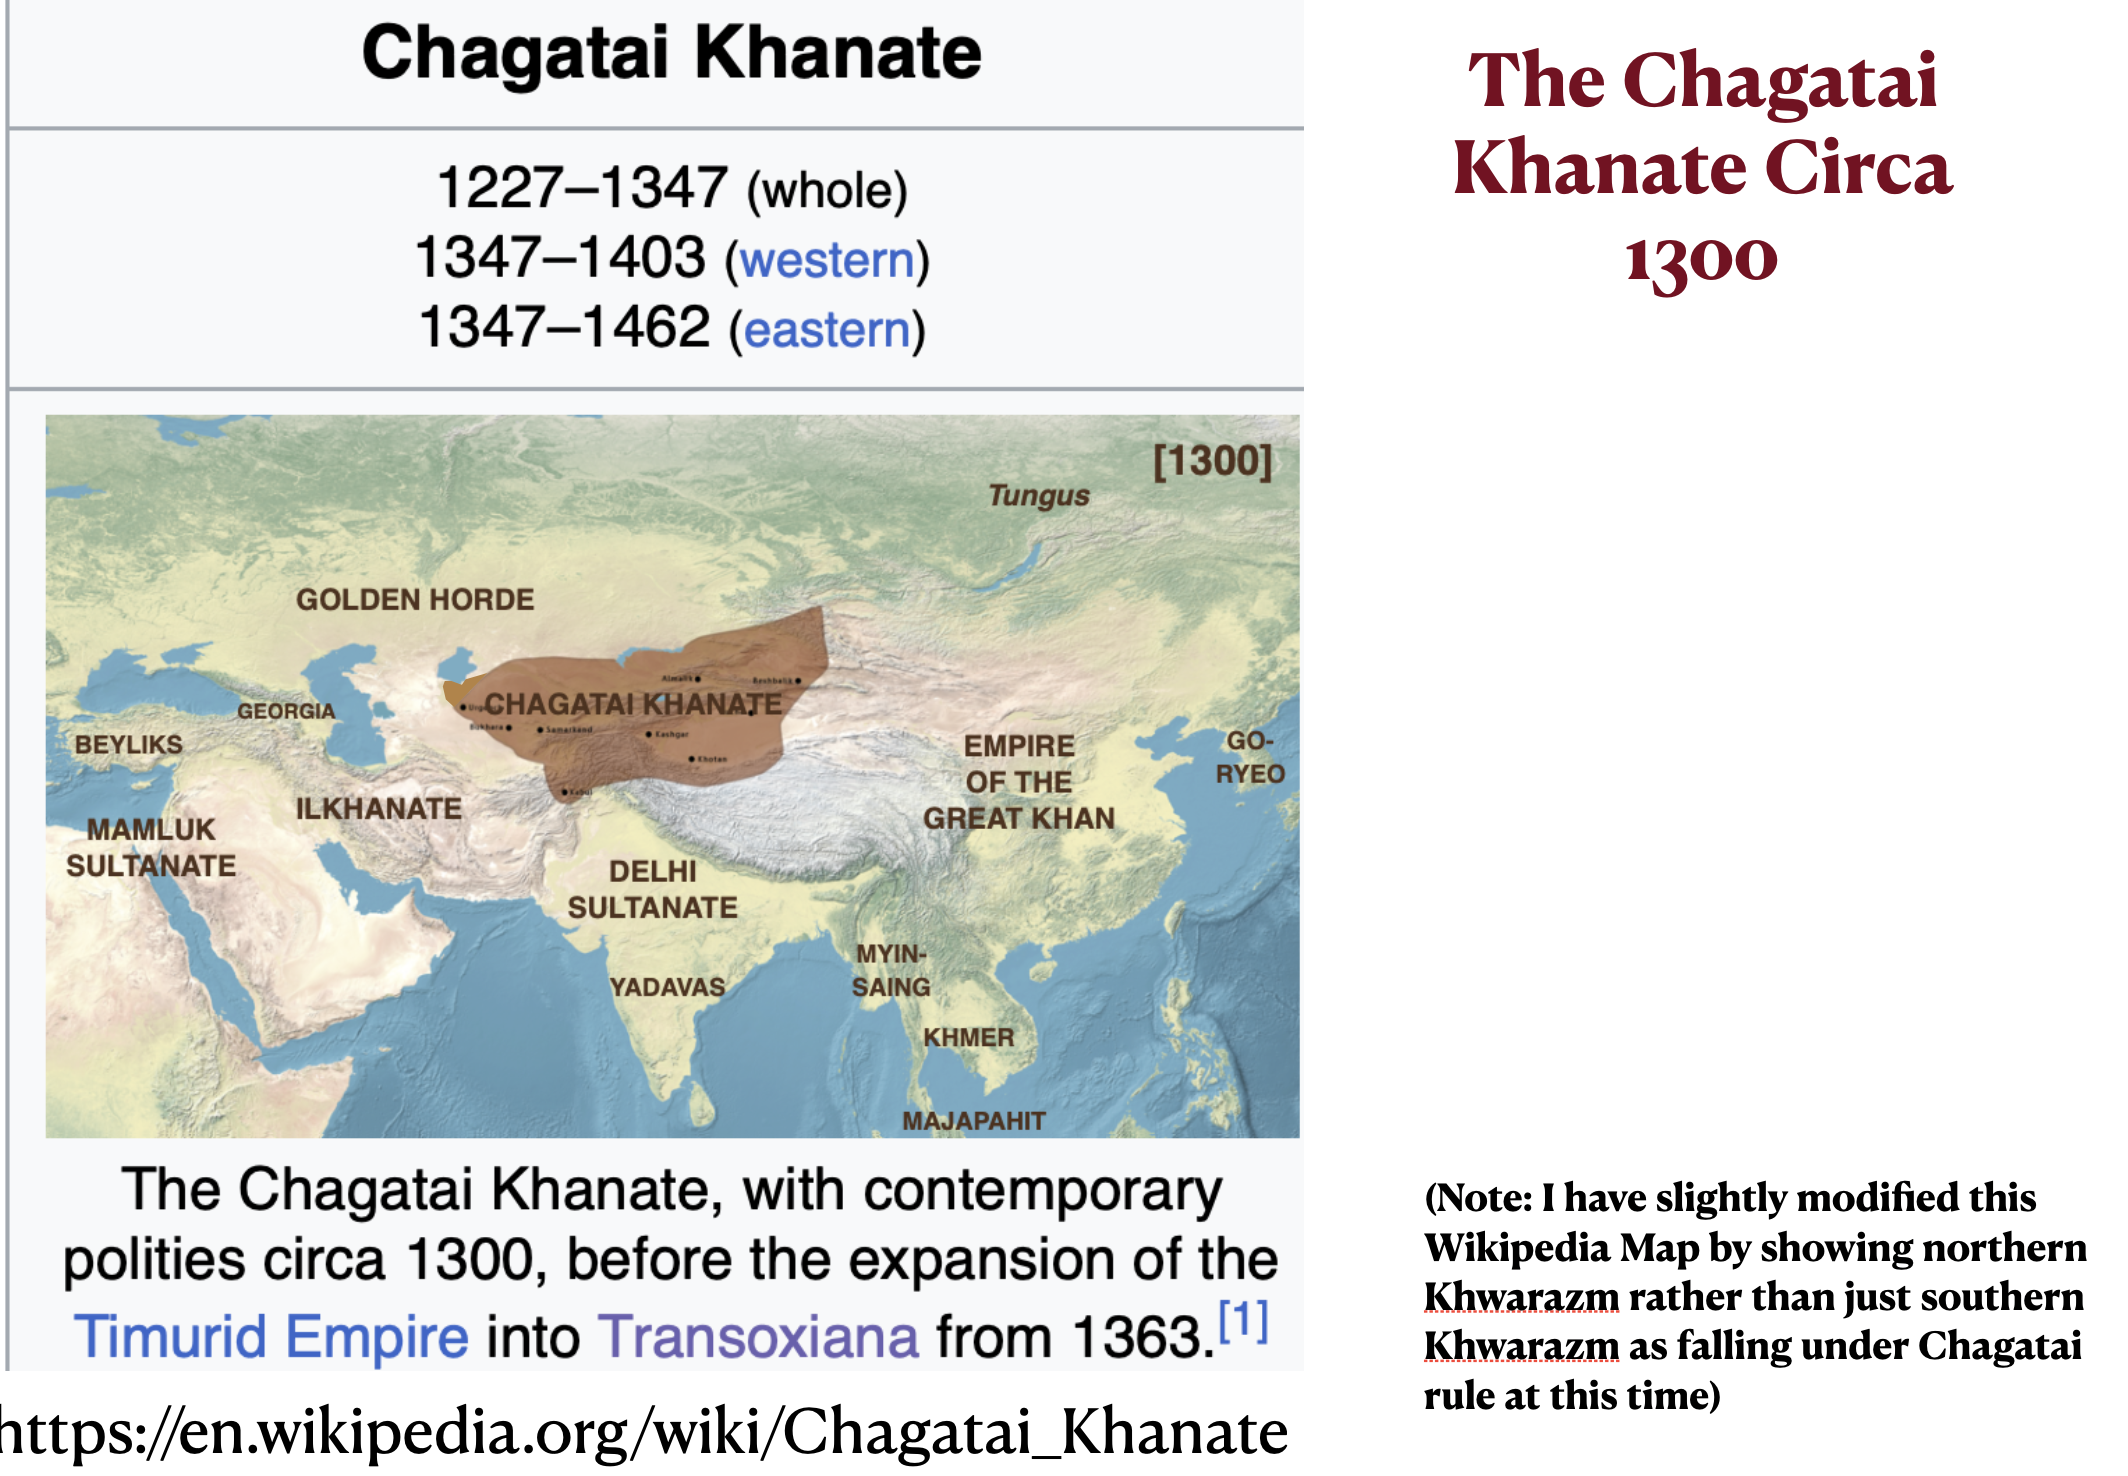
As discussed in the previous post, ancient Khwarazm had its own Iranian language, which gradually yielded to Persian in the early Islamic period. Somewhat later, as the military power of Turkic-speaking pastoralists grew, their dialects began to spread. After the Mongol conquest of 1219-1221, Khwarazm came under the rule of the Chagatai Khanate, named after, and initially ruled by, the second son of Genghis Khan. Under the patronage of this powerful state, a new Persianized Turkic literary language emerged, which was generally called “Turki” by its speakers and later deemed “Chagatai by Western scholars. This language gradually differentiated into two modern tongues, Uzbek* and Uyghur. Formal Chagatai continued to be employed as a literary language, however, until the early twentieth century. Its final flourishing occurred in the Khanate of Khiva, based in Khwarazm. As noted in the Wikipedia article on the language:
The reign of Muhammad Rahim II [of Khiva] marked the peak of a cultural revival, during which “more than a hundred works were translated, mostly from Persian into Chagatai Turkic.” Muhammad Rahim II introduced printing Khiva in 1874. He was also “a munificent patron” and wrote [Chagatai] poetry under the pen name Feruz.
Chagatai Khantage map
Although Persianized Turki (Chagatai/Uzbek) became the common language of Khwarazm, pastoral nomads speaking non-Persianized Turkic dialects continued to infiltrate, raiding and often settling. In the Daşoguz region, one of their tongues, Turkmen, was established as a minority language. In the northern periphery of Khwarazm, the ever-shifting channels of the Amu Darya delta created an unstable environment well suited to a combination of semi-nomadic herding, farming, and fishing. Here pastoralists from the north, speaking a dialect closely related to Kazakh, settled in the eighteenth and early nineteenth centuries. They would come to be known as the Karakalpak people, their language labeled with the same term.
One could therefore argue that the Soviet political division of Khwarazm was instituted to reflect the region’s ethnolinguistic divisions, yielding a Karakalpak-speaking region in the north and east (Karakalpakstan), a Turkmen-speaking region in the center (Daşoguz in Turkmenistan), and a core Uzbek-speaking region in the southeast (Khorazm in Uzbekistan). Significantly, although all of these language are Turkic, they belong to different branches of this large family.**
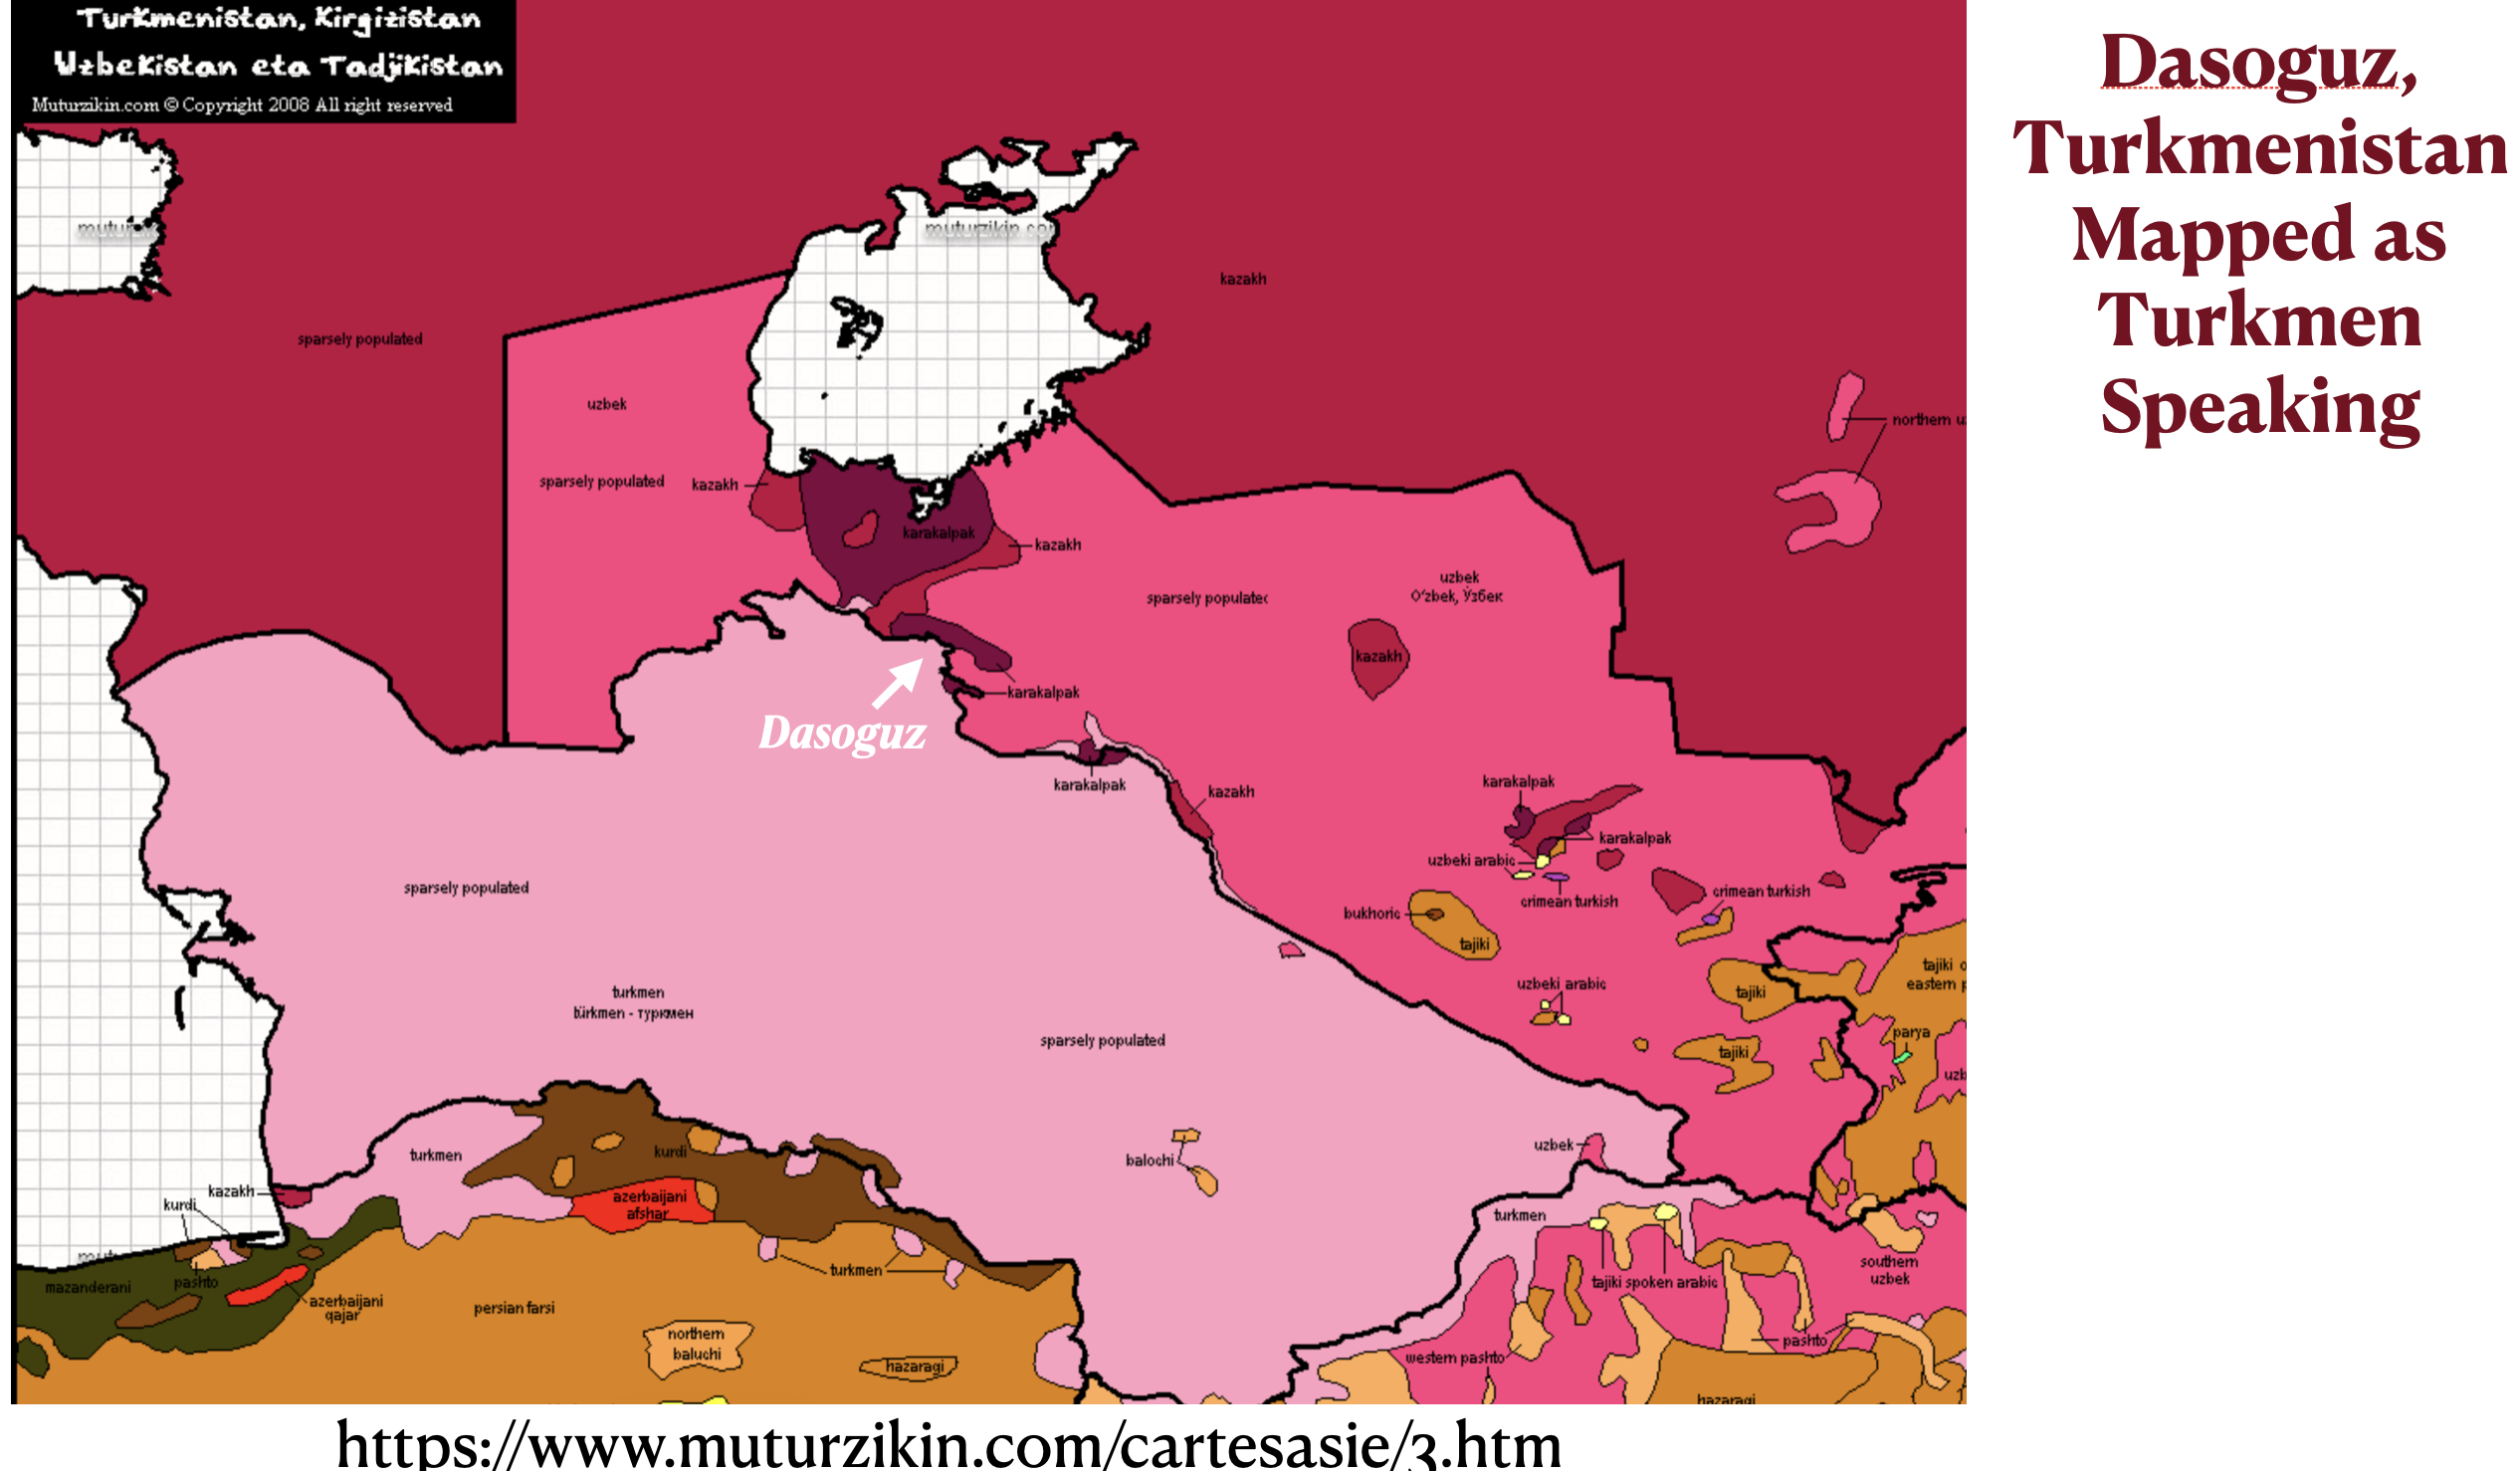
Such a view, however, is fundamentally misleading. Under Stalin, the theoretically autonomous areas of Soviet minority groups were effectively stripped of their autonomy and were in many cases re-engineered to prevent disfavored peoples and regions from gaining too much power. It was probably for this reason that the original “Khorezm People’s Soviet Republic” was disassembled and divided between what would eventually became Turkmenistan and Uzbekistan. The Daşoguz region, for example, had a large Uzbek majority when it was assigned to the Turkmen Soviet Socialist Republic. It took aggressive “Turkmenization” programs, under both the Soviet Union and independent Turkmenistan, to gave it a Turkmen-speaking majority. Yet up to this day, roughly a third of the people of Daşoguz still speak Uzbek as their mother tongue. Uzbek probably remains the majority language of the larger cities of this mostly rural region. Interestingly, some language maps portray the settled portion of Daşoguz as Turkmen speaking while others portray it as Uzbek speaking (see below).
Map of the Uzbek Language
Languages of Central Asia map
However the processes of ethno-linguistic change and geopolitical machination occurred, the common language and culture of Khwarazm was largely erased, along with its standing as discrete unit of political geography. This undermining of the identity of Khwarazm would eventually be accompanied by the weakening of its economy and ecological foundation, as we will see in the next GeoCurrents post.
* The naming of these languages has a confusing and contradictory history. Historically, “Uzbek” referred to a Kipchak Turkic language, closely related to Kazakh, that was spoken by nomadic pastoralists who conquered much of the agricultural zone of Central Asia. Most of their descendants adopted the Persianized Karluk Turkic language of the majority population, variously called “Turki,” “Sart,” or, for its literary form, “Chagatai.” The original Uzbek language, however, continued to be spoken by small grounds of pastoralists. In the early Soviet period, the majority Karluk language was renamed “Uzbek,” while the original Uzbek language essentially disappeared due to the decline of nomadic pastoralism in the region.
** Turkmen is an Oghuz Turkic langue, belonging to the same branch as Turkish and Azerbaijani. Karakalpak is a Kipchak Turkic language, belonging to the same branch as Kazakh and Kyrgyz. Uzbek is a Karluk Turkic language, belonging to the same branch Uyghur.
The modern region of Khorasan covers three provinces in northeastern Iran: North Khorasan, Razavi Khorasan, and South Khorasan. Razavi Khorasan, the name of which refers to Ali al-Rida, the eighth Imam of Twelver Shia Islam, is by far the most populous and important of the three (see the map below). Before 2004, this entire region constituted a single Khorasan province. Historically speaking, however, the term “Khorasan” – “land of the rising sun” – covered a much larger area. In the strict sense of the term, it also extended across northern Afghanistan and most of Turkmenistan, and is usually mapped accordingly. In this scheme, Khorasan terminated at the Oxus River (Amu Darya), with the lands beyond it called “Transoxiana” in Western sources and sometimes Mā Warāʾ an-Nahr (“the lands beyond the river”) in Persian and Arabic sources. But Persian and Arabic geographers often further extended Khorasan across the Amu Darya to include much of what is now Tajikistan and Uzbekistan.
Iran’s Old and New Provinces of Khorasan map
Khorasan in this “greater” sense might be regarded as the eastern portion of the historically Persian-speaking zone. As noted in the Wikipedia article on “Khorasan Province:”
Some of the main historical cities of Persia are located in the older Khorasan: Nishapur and Tus (now in Iran); Merv and Sanjan (now in Turkmenistan); Samarkand and Bukhara (both now in Uzbekistan); Herat and Balkh (now in Afghanistan); and Khujand and Panjakent (now both in Tajikistan).
Historical Greater Khorasan and the Current Extent of the Persian Language map
As the map posted above shows, most of this “older Khorasan” is inhabited to this day by Persian speakers, although the language is commonly called “Dari” in northern Afghanistan and “Tajik” in Tajikistan. Storied “Uzbek” cities such as Bukhara and Samarkand are probably still majority Persian-speaking (as the mother tongue), although official statistics claim that most residents primarily speak Uzbek, a Turkic language. Turkmenistan, on the other hand, is no longer part of the Persian language zone. Its once-great Persian cities, such as Merv and Sanjan, were destroyed centuries ago.
As was noted in the previous GeoCurrents post, the historical region of Khorasan is commonly regarded as forming the intellectual core of the Persian-speaking world from roughly 800 to 1200 CE/AD, the time of its greatest scholarly achievements. The Wikipedia article on the region lists 10 prominent scientifically minded scholars from the region who lived during this period. As the maps posted below show, four of them were from what is now the Iranian region of Khorasan (all from the province of Razavi Khorasan), two were from what is now northern Afghanistan, a region once called Bactria, and two were from Transoxiana, or Mā Warāʾ an-Nahr, a region once called Sogdia or Sogdiana. All eight were thus natives of “Greater Khorasan” in the extended sense of the term.
Birthplaces of Medieval Scientists from Khorasan map
Birthplaces of Medieval Scientists from Khorasan, map 2
The remaining two scholars were from Khwarazm, an important region focused on the inland delta of the Amu Darya (Oxus) River just to the south of the (former) Aral Sea. This region has rarely been included in Khorasan. AI (Grok), however, tells me that that the noted tenth-century Persian geographer and traveler Istakhri did classify it in such a manner, reflecting “the flexible, sometimes expansive use of “Khorasan” in medieval texts, where it could loosely denote eastern Iranian/Central Asian lands east of the central Iranian deserts.”
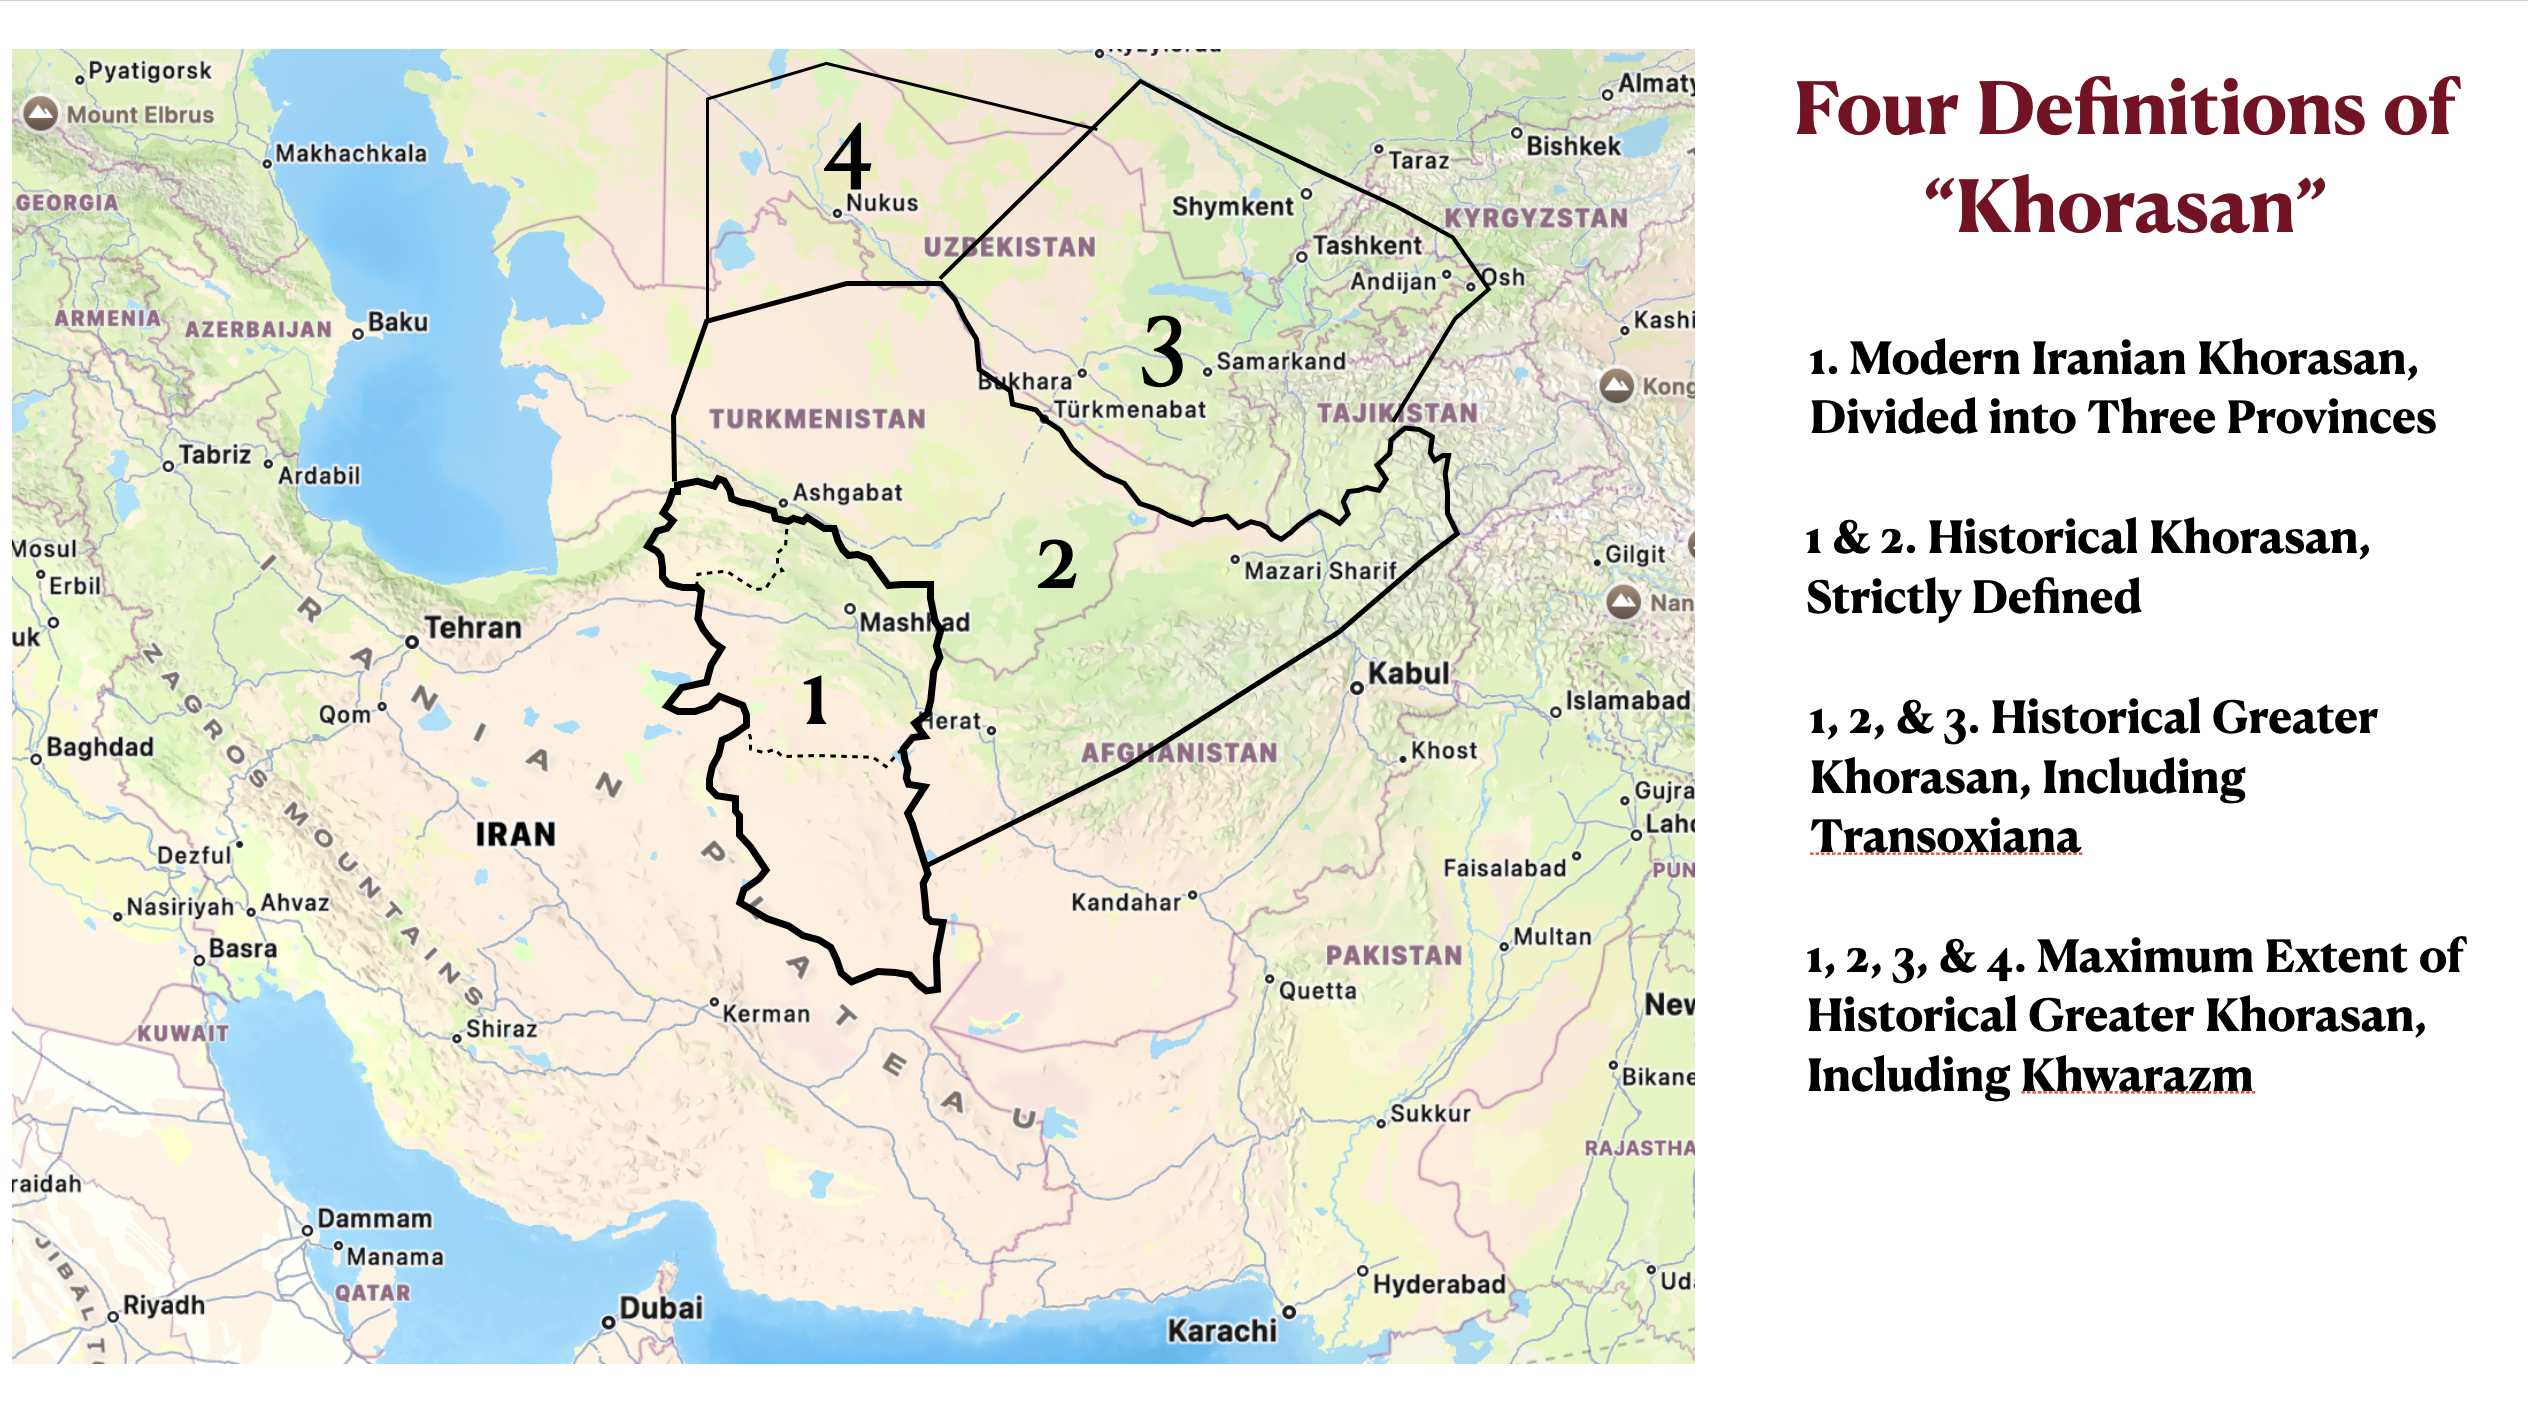
The term “Khorasan” can thus be regarded as possibly denoting four separate but nesting regions: modern Khorasan (northeastern Iran); greater Khorasan in the strict sense (adding much of Turkmenistan, and northern Afghanistan); greater Khorasan in the extended sense (adding Transoxiana or Mā Warāʾ an-Nahr); and “greatest” Khorasan (adding Khwarazm).
Four Definitions of Khorasan, map
If Khorasan is to include Khwarazm, in cannot be defined as the eastern portion of the historically Persian-speaking region, as Khwarazm was not, at least during its intellectual heyday, Persian speaking. Its native tongue at the time was Khwarezmian, an Eastern Iranian language more closely related to Pashto (the language of the Pashtun people) than to Persian/Farsi. (It was even more closely related to Sogdian and Bactrian, which had been spoken in Transoxiana and northern Afghanistan respectively before being replaced by Persian.) But Khwarazm had been part of the greater Persian cultural sphere, and by the thirteenth century its own language was also being replaced by Persian. Turkic dialects later spread, and today the people of the region speak the Turkic language Karakalpak (closely related to Kazakh), and are ethnically deemed Karakalpaks (literally meaning “black hats.
The two scholars from Khwarazm noted on the map of medieval scientists from “Khorasan”, al-Buruni and Al-Khwarizmi, deserve further consideration and will therefore be examined in the next GeoCurrents post.
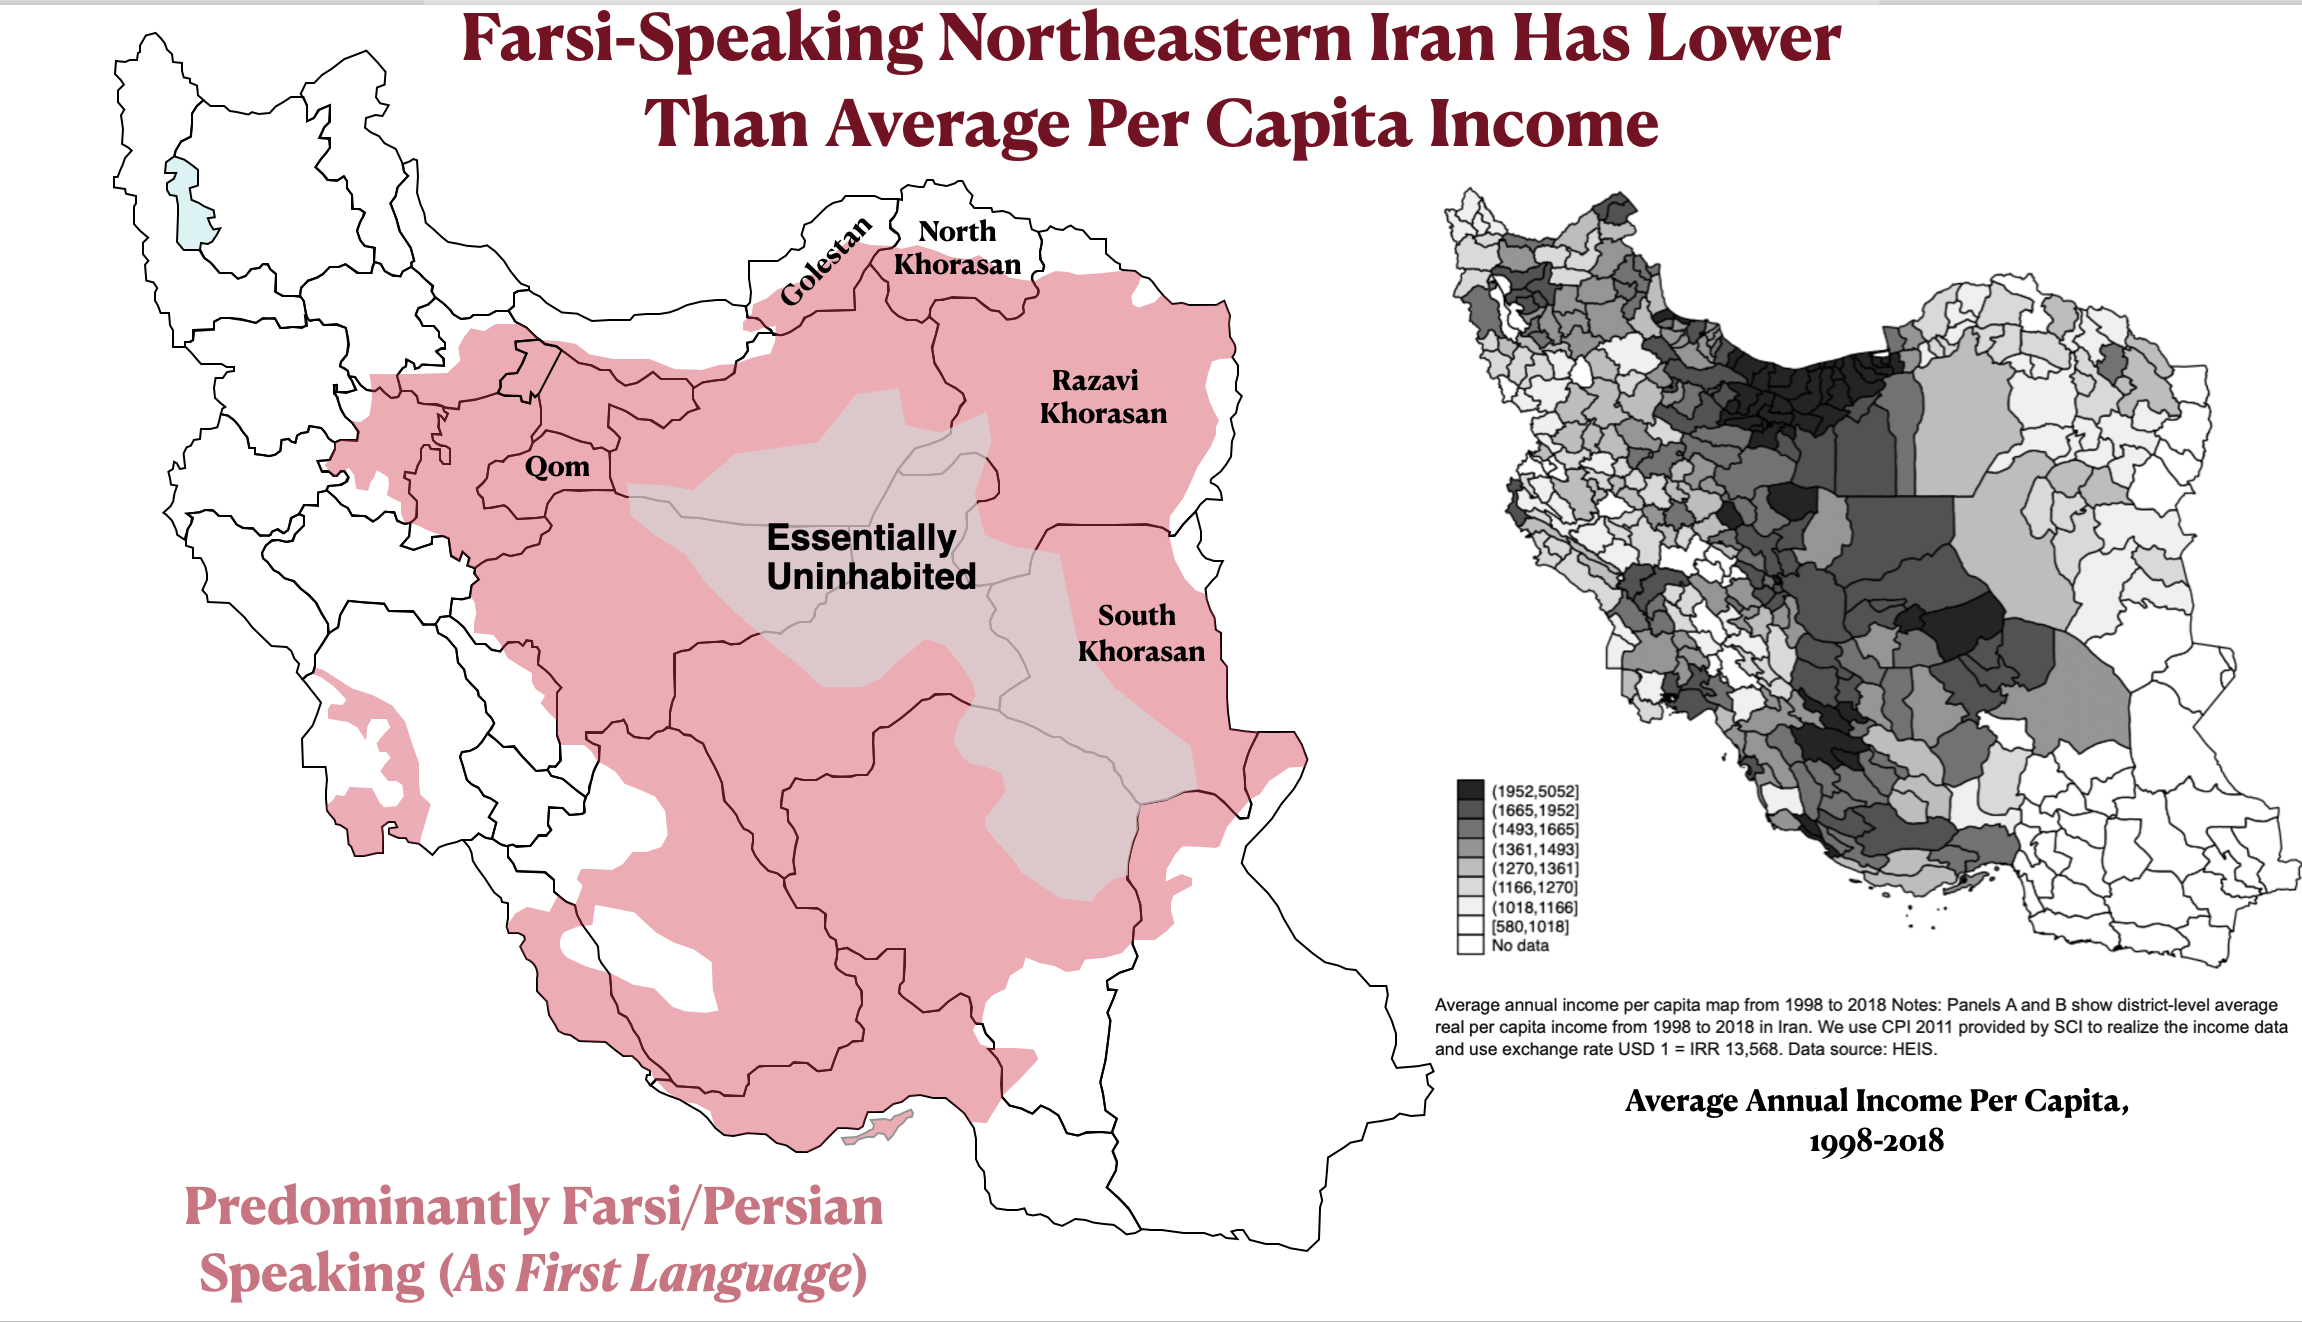
The most recent GeoCurrents posts expressed skepticism of the idea that the Persian, of Farsi-speaking, regions of Iran are more economically developed than the non-Persian regions. As I showed, several non-Persian regions have relatively high per capita income and production. It is also true that several Persian regions have relatively low economic rankings. South Khorasan in eastern Iran is the prime example. As can be seen in the map sets posted below, this sparsely populated and overwhelmingly Farsi-speaking (90-95 percent) province has comparatively low per capita GDP and per capita income.
Iran Farsi-Speaking Regions Per Capita Income Map
Iran Farsi-Speaking Regions and Per Capita GDP Map
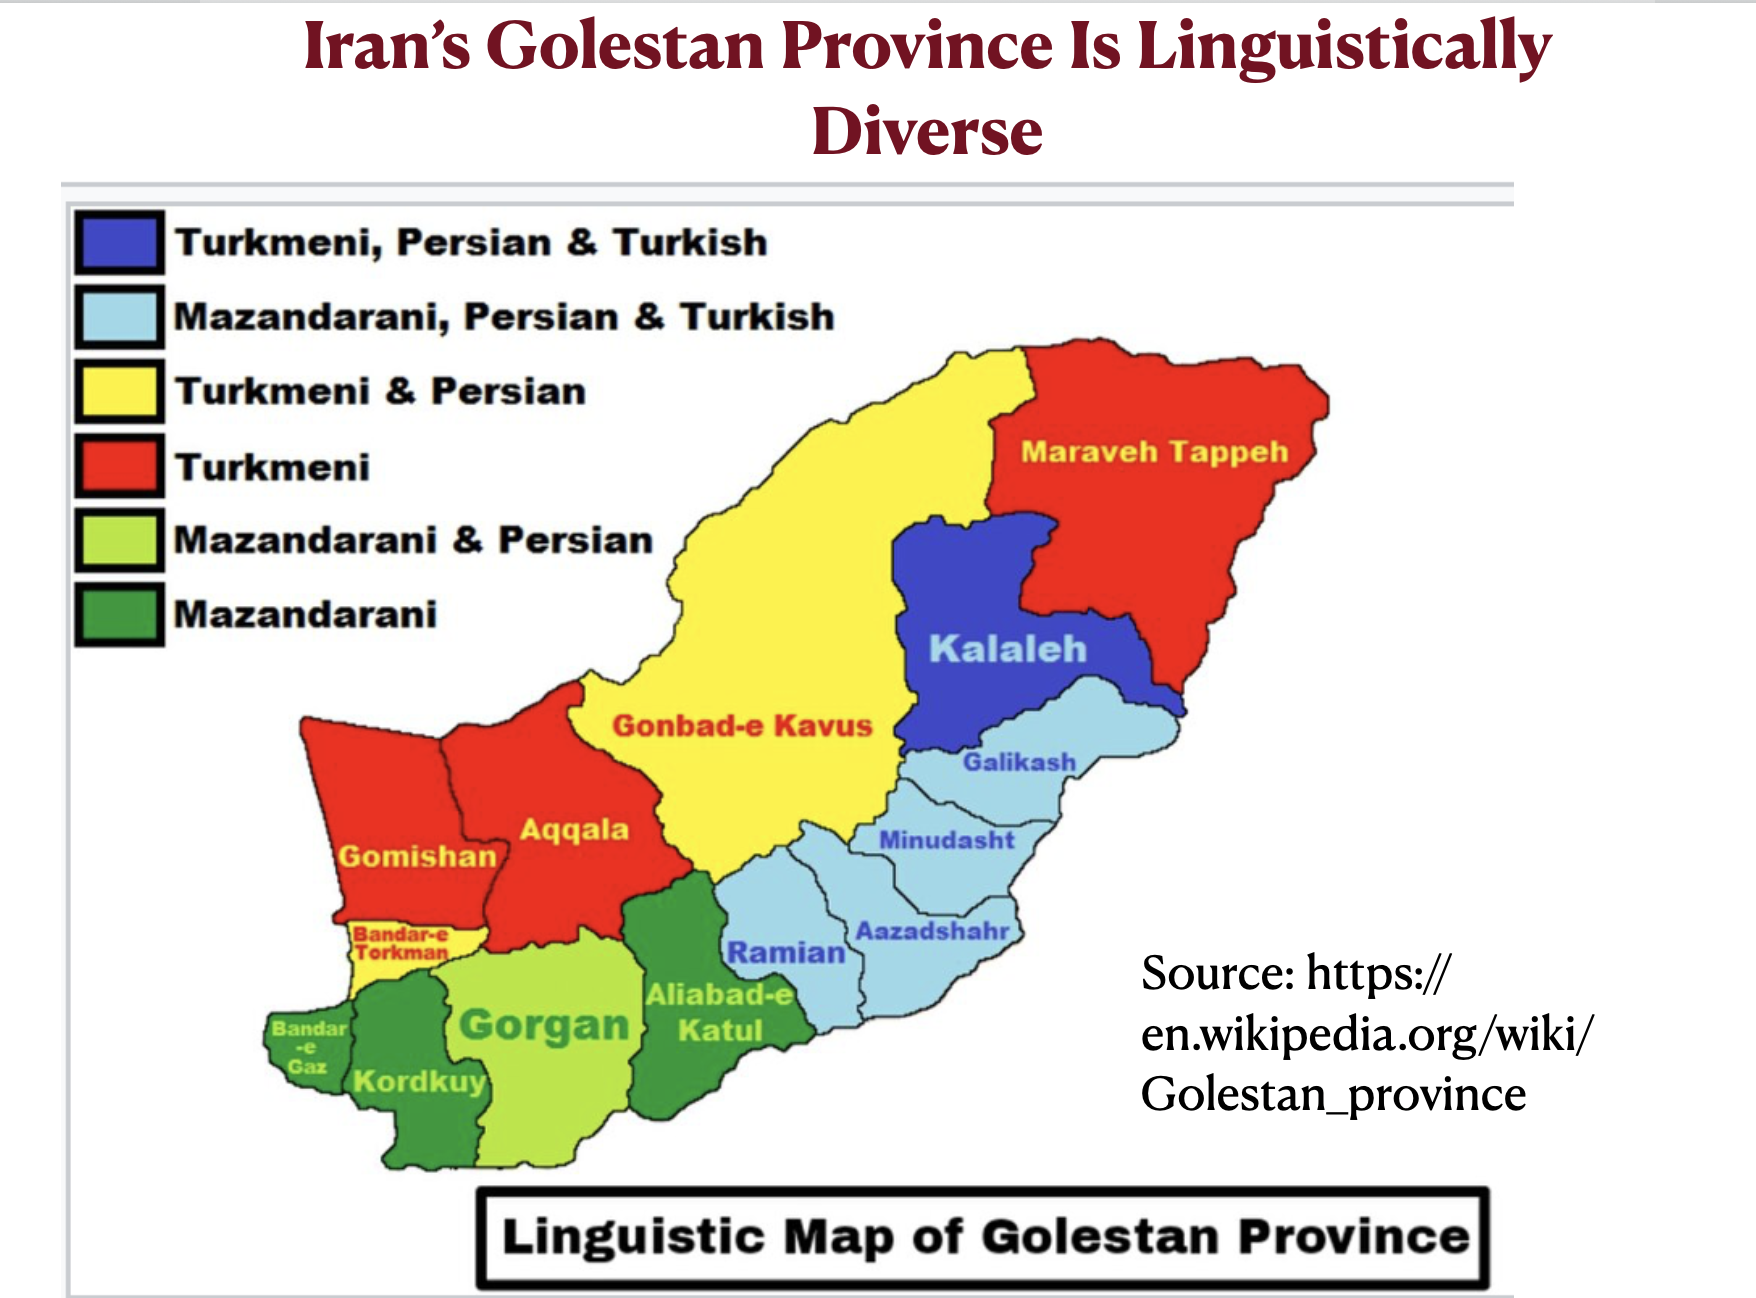
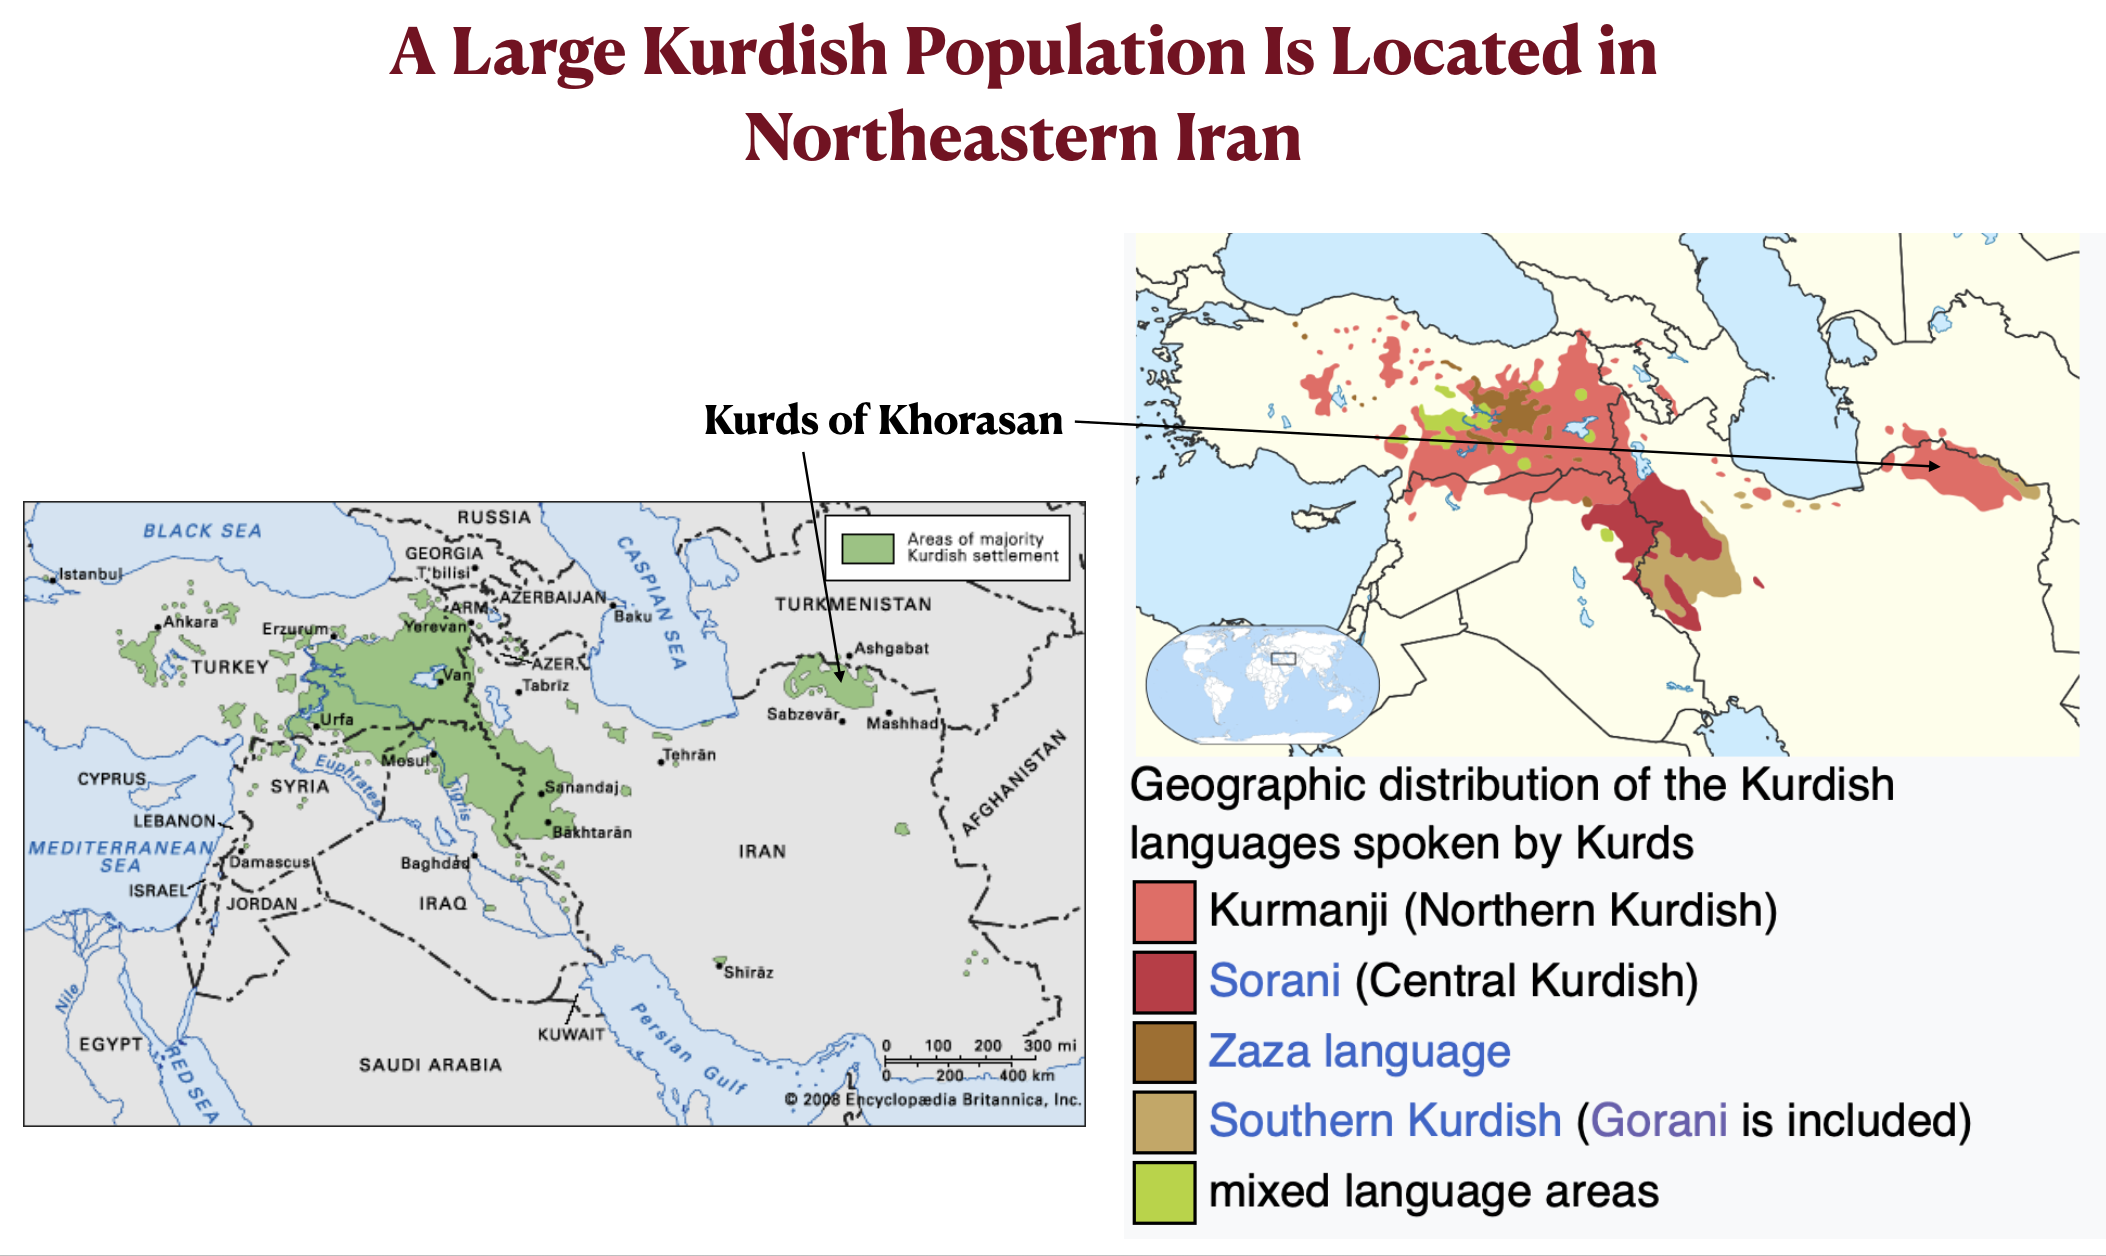
Nearby provinces in northeastern Iran also have lower economic rankings than provinces in the country’s central region. Razavi Khorasan, also heavily Persian, ranks near the middle while North Khorasan and Golestan are clearly below average. North Khorasan and Golestan, however, do not have Farsi-speaking majorities. Instead, they are characterized by ethnolinguistic mixtures, which are particularly complex in Golestan (see the map posted below). North Khorasan, for its part, has a Kurdish plurality. (According to one AI assessment [Grok], it is approximately 40-50 Kurdish, 25-50 percent Persian and Tat, and 15-25 percent Khorasani Turkic.) In 2017, Iran Front Page magazine referred to North Khorasan as the “land of tribal treasures” owing to its linguistic diversity. Marriage across ethnic lines, however, seems to be diminishing such diversity. According to one study, in 2018 43 percent of the Kurds of North Khorasan were married to non-Kurds.
Iran Golestan Province Language Map
The strong Kurdish presence in northeastern Iran might seem surprising, as this region is far from the Kurdish homeland. Under the Safavid dynasty (1501 to 1736), Shi’ite Kurds were moved to this region to help guard against incursions by Uzbeks and others. According to Encyclopedia Iranica, this policy caused its own problems, bringing a period of economic decline to the region:
These transplantations brought in their wake radical changes in the demographic, political, economic, and social fabric of the province of Khorasan. They led to changes in the environment, with towns and villages destroyed or rebuilt and new ones created. Given the Kurdish nomadic presence and its increasing impact, rural and urban life retreated in the face of tribal migrations. In the course of over a century and a half, the irrigation system was to some extent abandoned, and more intricate forms of agriculture for silk or rice cultivation gave way to the production of pastoral products. The increasing power of the Kurdish tribal leaders (il-ḵāns) engendered resistance and rebellion against the central government.
Kurdish Distribution, Including North Khorasan, maps
Although the three provinces of Khorasan have a modest standing in the economic geography of Iran, Khorasan’s historical, cultural, and demographic significance is profound. Razavi Khorasan, with almost 7 million inhabitants, is the second most populous province in the country. Its capital, Mashhad, with some three and a half million inhabitants, is Iran’s second largest city. Mashhad is also a major religious center and tourism destination. Its mausoleum of Ali al-Rida, the eighth Imam of Twelver Shi’ism, is visited by an estimated 30 million pilgrims every year .
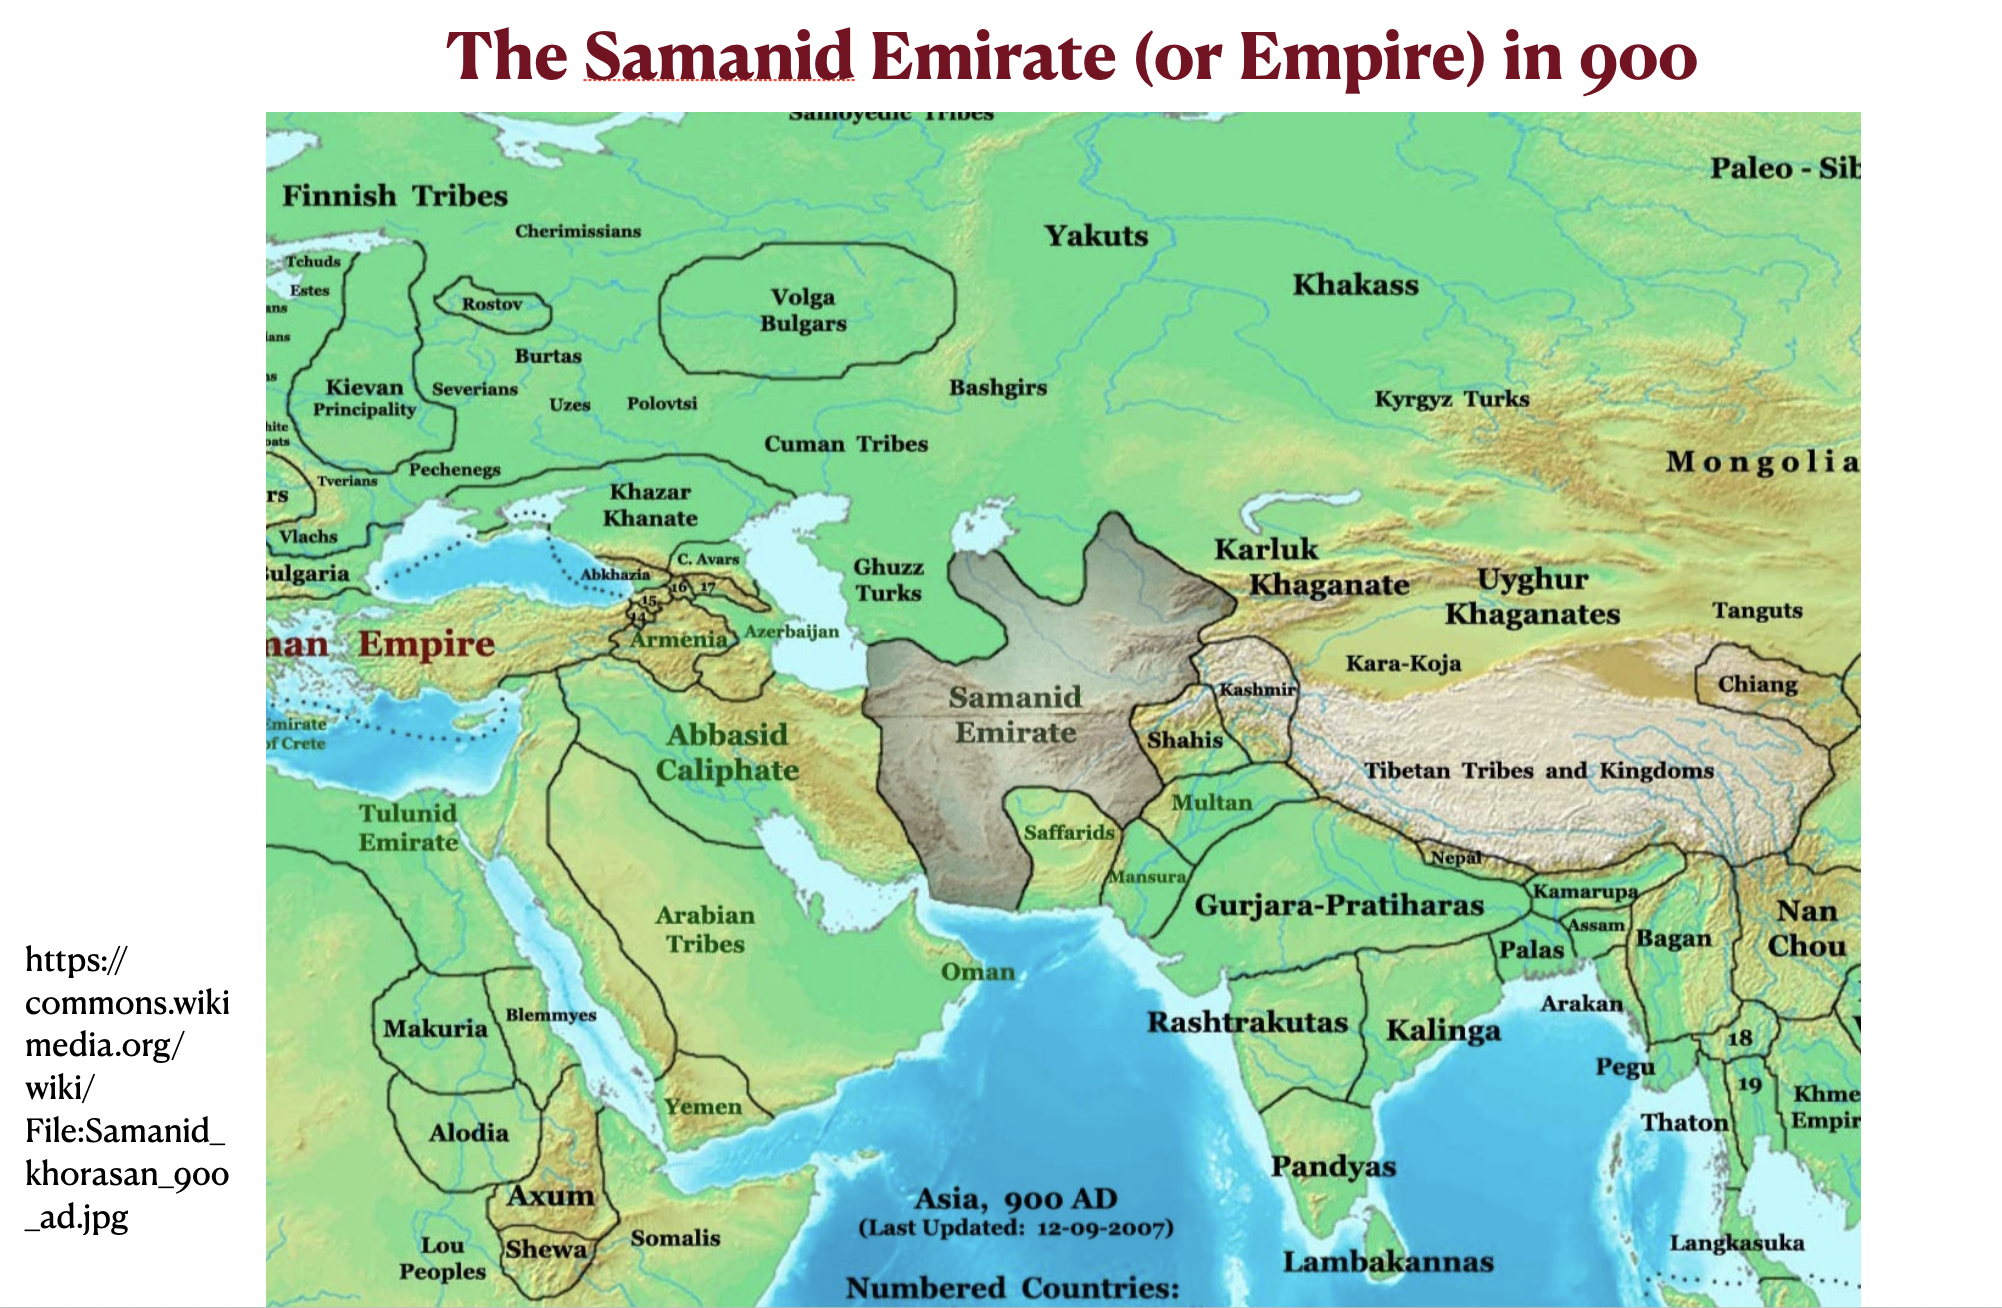
The Khorasan provinces of northeastern Iran constitute a small remnant of what was once a much larger region. Historical Khorasan also included western and northern Afghanistan and most of what is now Turkmenistan. It was here that the New Persian language, or modern Persian, emerged in the ninth century, some 200 years after the Arab/Muslim conquest. The literary development of New Persian and the early flourishing of an explicitly Persian Muslim civilization was closely associated with the Samanid Empire (819 to 999), which originated in Khorasan and was based both there and in neighboring Transoxiania (modern Tajikistan and Uzbekistan). Ferdowsi (940–1025), author of Iran’s national epic, the Shahnameh (or Book of Kings), was a resident of Tus, a once-major city located near Mashhad in what is now Razavi Khorasan. Ferdowsi’s tomb, built in the early 1930s in the ancient Persian style, is also visited by millions of people every year.
Historical Khorasan Map
Samanid Empire in 900 Map
Long after the collapse of the Samanid Empire, Khorasan retained its cultural significance, serving as Persia’s center of literature and scholarship. According to the Wikipedia article on the region:
(Note, however, that some of these intellectual luminaries can be described as being from Khorasan only in the geographically broadest sense of the term, as will see in a later post.)
Finally, it should also be mentioned that Greater Khorasan plays an important role in Muslim beliefs about eschatology, or doctrines related to end of time. Several hadiths (saying attributed to the Prophet Mohammed) describe the future emergence of an unstoppable Muslim army carrying black flags and originating in Khorasan. According to Twelver Shi’ism, this force will allow the triumph of the Mahdi, a messianic figure who will rid the world of evil and bring about the culmination of history. Several leading figures in Iran have reportedly framed the current war with Israel and the United States as presaging the coming of the Madhi, including Aliraza Zakani, the mayor of Tehran, and Ayatollah Mohammed Mehdi Mirbagheri. It is widely believed that before the Mahdi comes, chaos will reign.
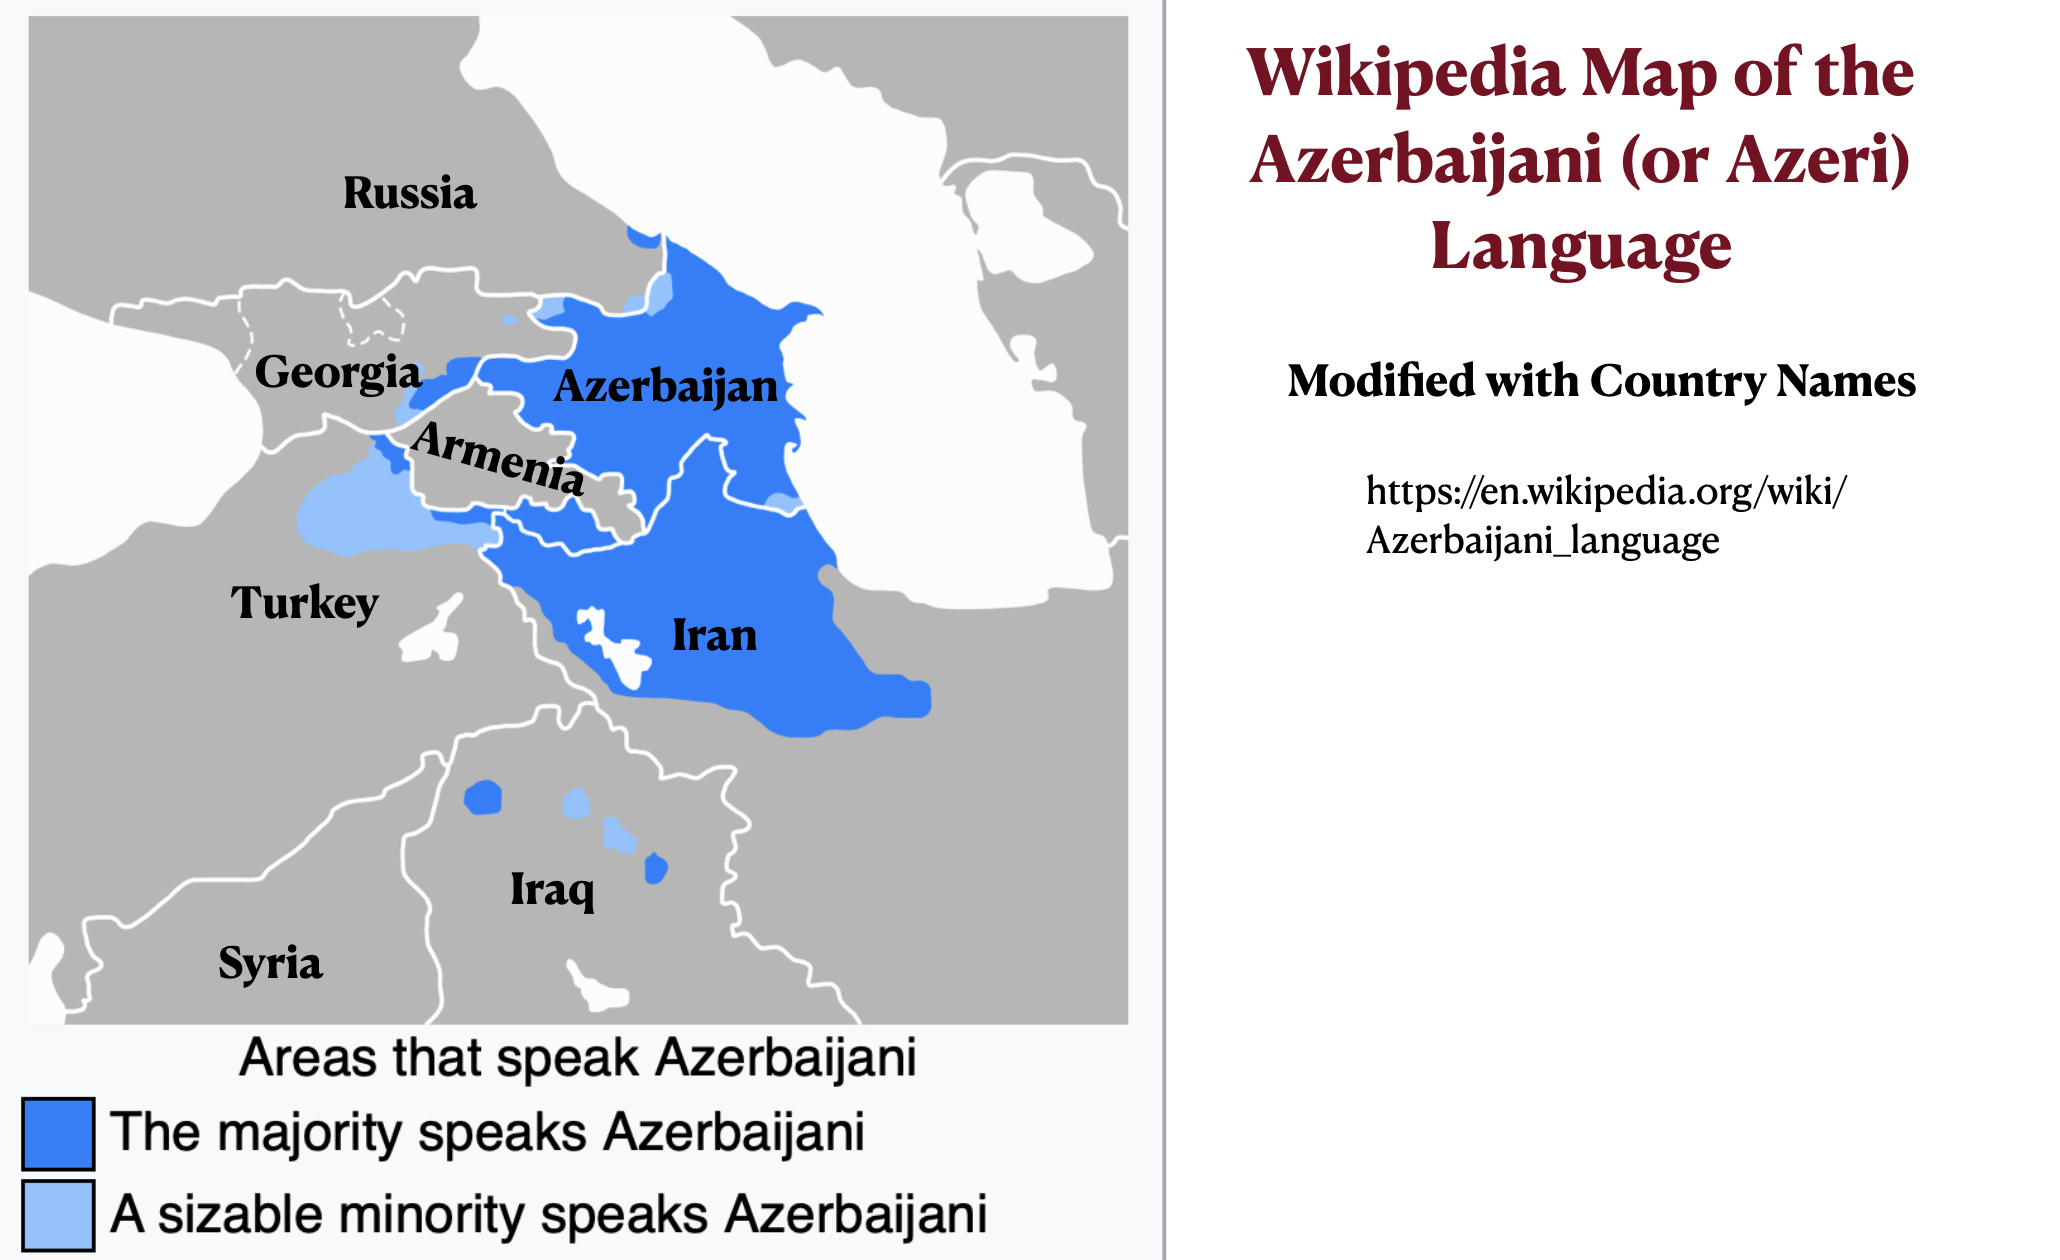
The previous post argued that the “Persian” (or Farsi-speaking) provinces of Iran are not necessarily more prosperous and economically developed than the “non-Persian” provinces, focusing on the relatively affluent but non-Farsi-speaking Caspian region, particularly Mazandaran province. The Azeri-speaking (or Azerbaijani-speaking) northwestern region of Iran also economically ranks somewhat higher than average. It is, however, less economically developed than the neighboring Azeri-speaking country of Azerbaijan.
Iranian Azerbaijan Income Map
Iranian Azerbaijan Per Capita GDP Maps
Rather than framing the issue of Iran’s uneven economic development around the distinction between Farsi- and non-Farsi speakers, it is better to organize it around the distinction between “core Iranian ethnic groups” and “non-core ethnic groups.” The Mazandaranis, for example, are not Farsi-speakers, but they are so integral to the Iranian nation that they have often been classified as “Persian.” The Wikipedia article on the Iranian province of Golestan, for example, claims that “The Mazandaranis who inhabit the foothills … were subsumed under the rubric ‘Persian’ by these official statistics.”
Although the Azeris, who speak a Turkic language, are never classified as Persians, they have been central players in the Iranian state and nation for centuries. According to many sources, Azeris are, if anything, over-represented in the country’s elite population. In the core provinces of Tehran and Alborz, Azeris constitute up to a quarter of the population. The actual percentage of Azeri-speakers in these provinces, however, is difficult if not impossible to determine due the prevalence of intermarriage and bilingualism. To be sure, cultural conflicts occasionally arise, such as the 2006 “cartoon cockroach controversy” analyzed in a previous GeoCurrents post. Overall, however, they are of little significance.
Azerbaijani language map
Although Azeri is in the Turkic language family, most of the inhabitants of “greater Azerbaijan” (northwestern Iran and independent Azerbaijan) seem to have spoken the Iranian language of Old Azeri (or Azari) up to the early-modern period. The region had been fully part of the Persian cultural sphere, and it largely remained so after the switch to a Turkic tongue.
The “Old Azari” language–previously one of the major Iranian languages–comprised a sprachbund of dialects distributed in a broad range between lake Urmia in the west and the Caspian littoral in the east. Old Azari seems to have shared a genetic affinity with the ancestor of the modern Talysh language, and it further appears to form a broader group with the so-called “Northwestern” branch of Iranian including modern Gilaki, Māzanderāni, Semnāni, and Zaza-Gorani. Some linguists hold that the southern Tāti varieties of Iranian Azerbaijan … are peripheral remnants of Old Azari. As such, this language has been spoken in the region of Azerbaijan for at least three millennia.
…
It appears Old Azari only lost its status as the majority language between the 16th-17th centuries with the ascent of the Qizilbash-backed Safavids. The subsequent influx of numerous Turkic military elements into the region further spread Turkic at the detriment of Old Azari, which in turn receded and ceased to be used, at least in the major urban centers. Notwithstanding the city of Tabriz maintained a number of distinctly Old Azari-speaking neighborhoods well into the Safavid period with the poet Ruhi Anārjānī composing a compendium of the language as late as the 17th century. However by the turn of the 20th century the Turkification of Azerbaijan was near completion, with the old Iranic speakers found exclusively in remote recesses of the mountains or other isolated areas such as Harzand village in Marand. Lamentably, language shift is currently in progress and the remaining Tāti dialects face a state of attrition and imminent endangerment.
Afsheen Sharifzadeh also notes that the Azerbaijani dialects of northwestern Iran and independent Azerbaijan are currently diverging:
The Northern and Southern varieties of Azerbaijani are moderately mutually intelligible without training. Since, for several decades, there has been little, if any, cultural exchange between the two parts of Azerbaijan, the mutual intelligibility is decreasing. Today the two languages are remarkably distinct in phonology, morphology, syntax, and source of loanwords; purist efforts upon the Northern variety have uprooted numerous Persianisms in favor of Russianisms and revisionist Turkic models, while the Southern variety continues to rely upon Persian much as it has since its arrival to the region.
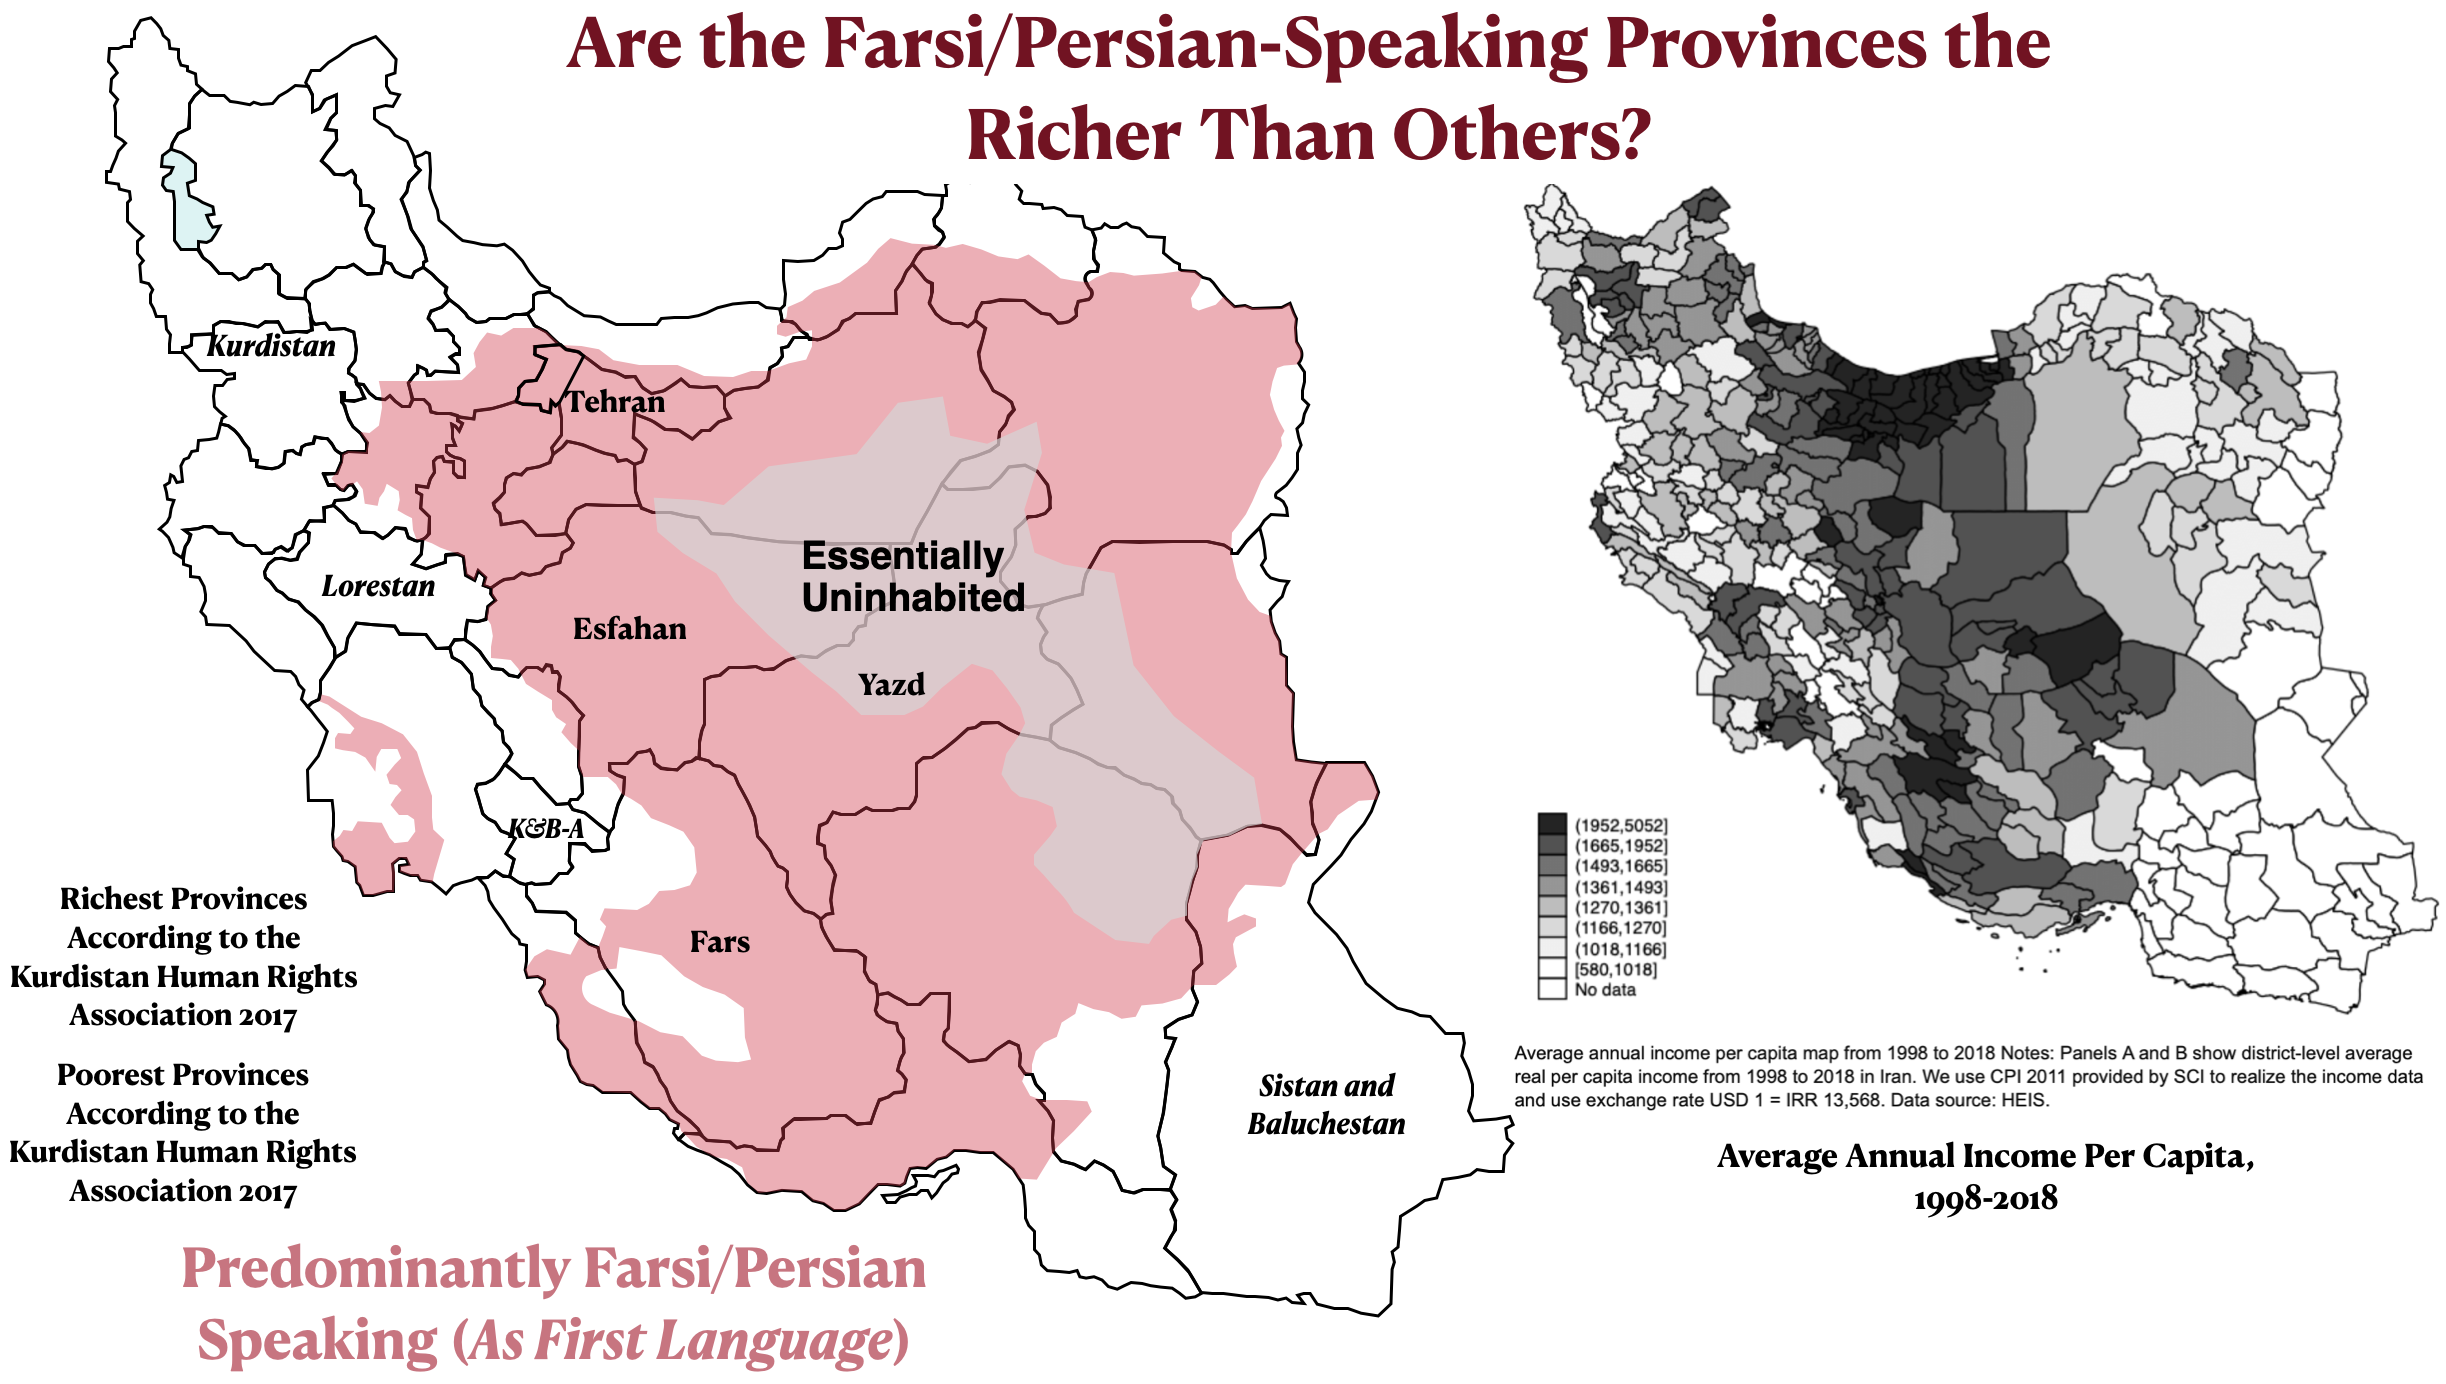
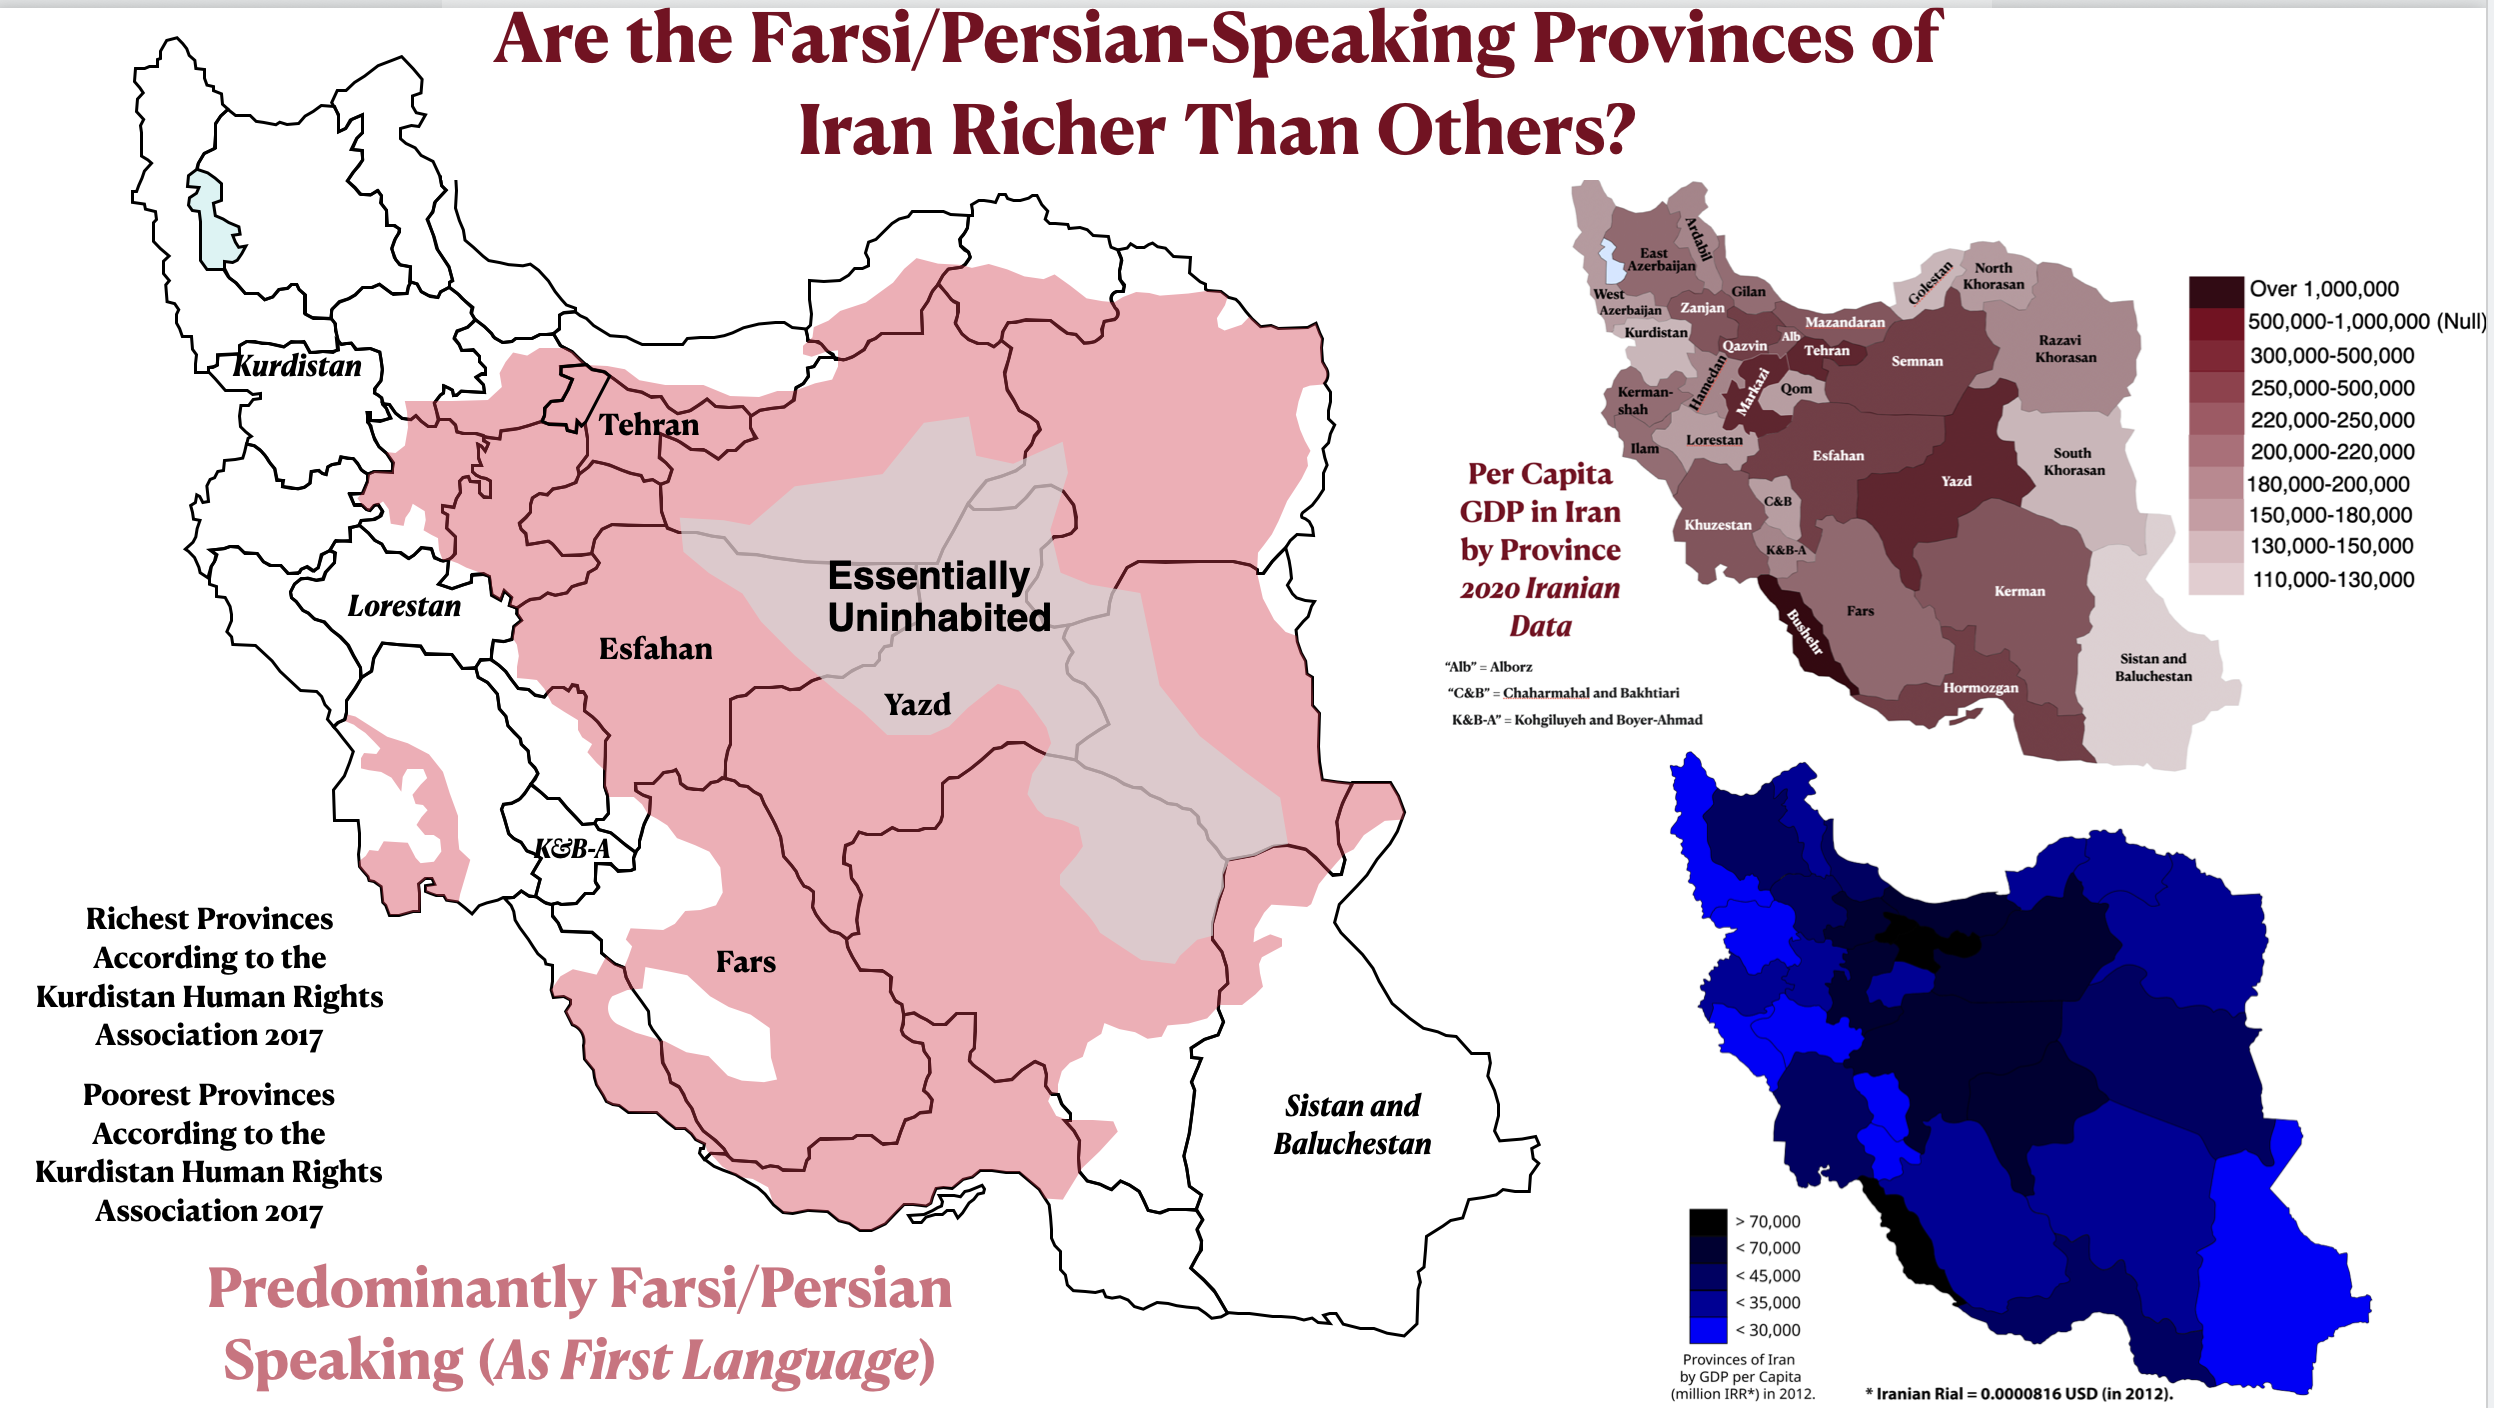
The previous GeoCurrents post showed that the location of oil and natural gas deposits provides a partial explanation of the differences in the distribution of wealth and economic productivity across the country. But other factors must also be considered. Could language and ethnicity play a role? It has often been argued that the Persian, or Farsi-speaking, central area of Iran is more developed than the non-Persian peripheries. In 2017, for example, the Kurdish Human Rights Association asserted that “Persian province are the richest and non-Persian provinces are the poorest,” arguing that discrimination against Kurds and other minority groups explains this pattern.
But is it actually true that “the Persian province” are the richest parts of Iran? Although this assertion does have some validity, it is also misleading, as we will see in the next few GeoCurrents posts.
A little background on the ethnic situation is first needed. Iran is a multi-lingual country with a well-established sense of common national identity across most of its ethnic groups. Farsi, or Persian, is the national language and is spoken by almost everyone in the country. But it is the mother tongue of only around 50 to 62 percent of Iran’s population. According to some estimates, as many as twenty-five percent speak Azeri, or Azerbaijani, as their first language (see the pie chart below), although most sources put the figure at around 15 percent. The modified Wikipedia map posted below shows the distribution of the most important languages of Iran. As can be seen, Farsi/Persian dominates the central region, with minority languages located in most peripheral areas.
Iran Languages Map
Iran Language Pie Chart
For the next set of maps, I have isolated the Farsi/Persian-speaking region from the language map posted above so that it can be compared with the economic maps of Iran analyzed in the preceding GeoCurrents posts. The second figure below compares the map of Farsi speakers with two maps of per capita GDP, and the first compares it with a map of per capita average income. As these comparisons show, there is a correlation between Persian ethnicity and higher-than-average economic productivity and income, but it not particularly strong. Several non-Persian areas, for example, have elevated economic figures.
Iran Farsi-Speaking Areas and Average Income Map
Iran Farsi-Speaking Area and Per Capita GDP map
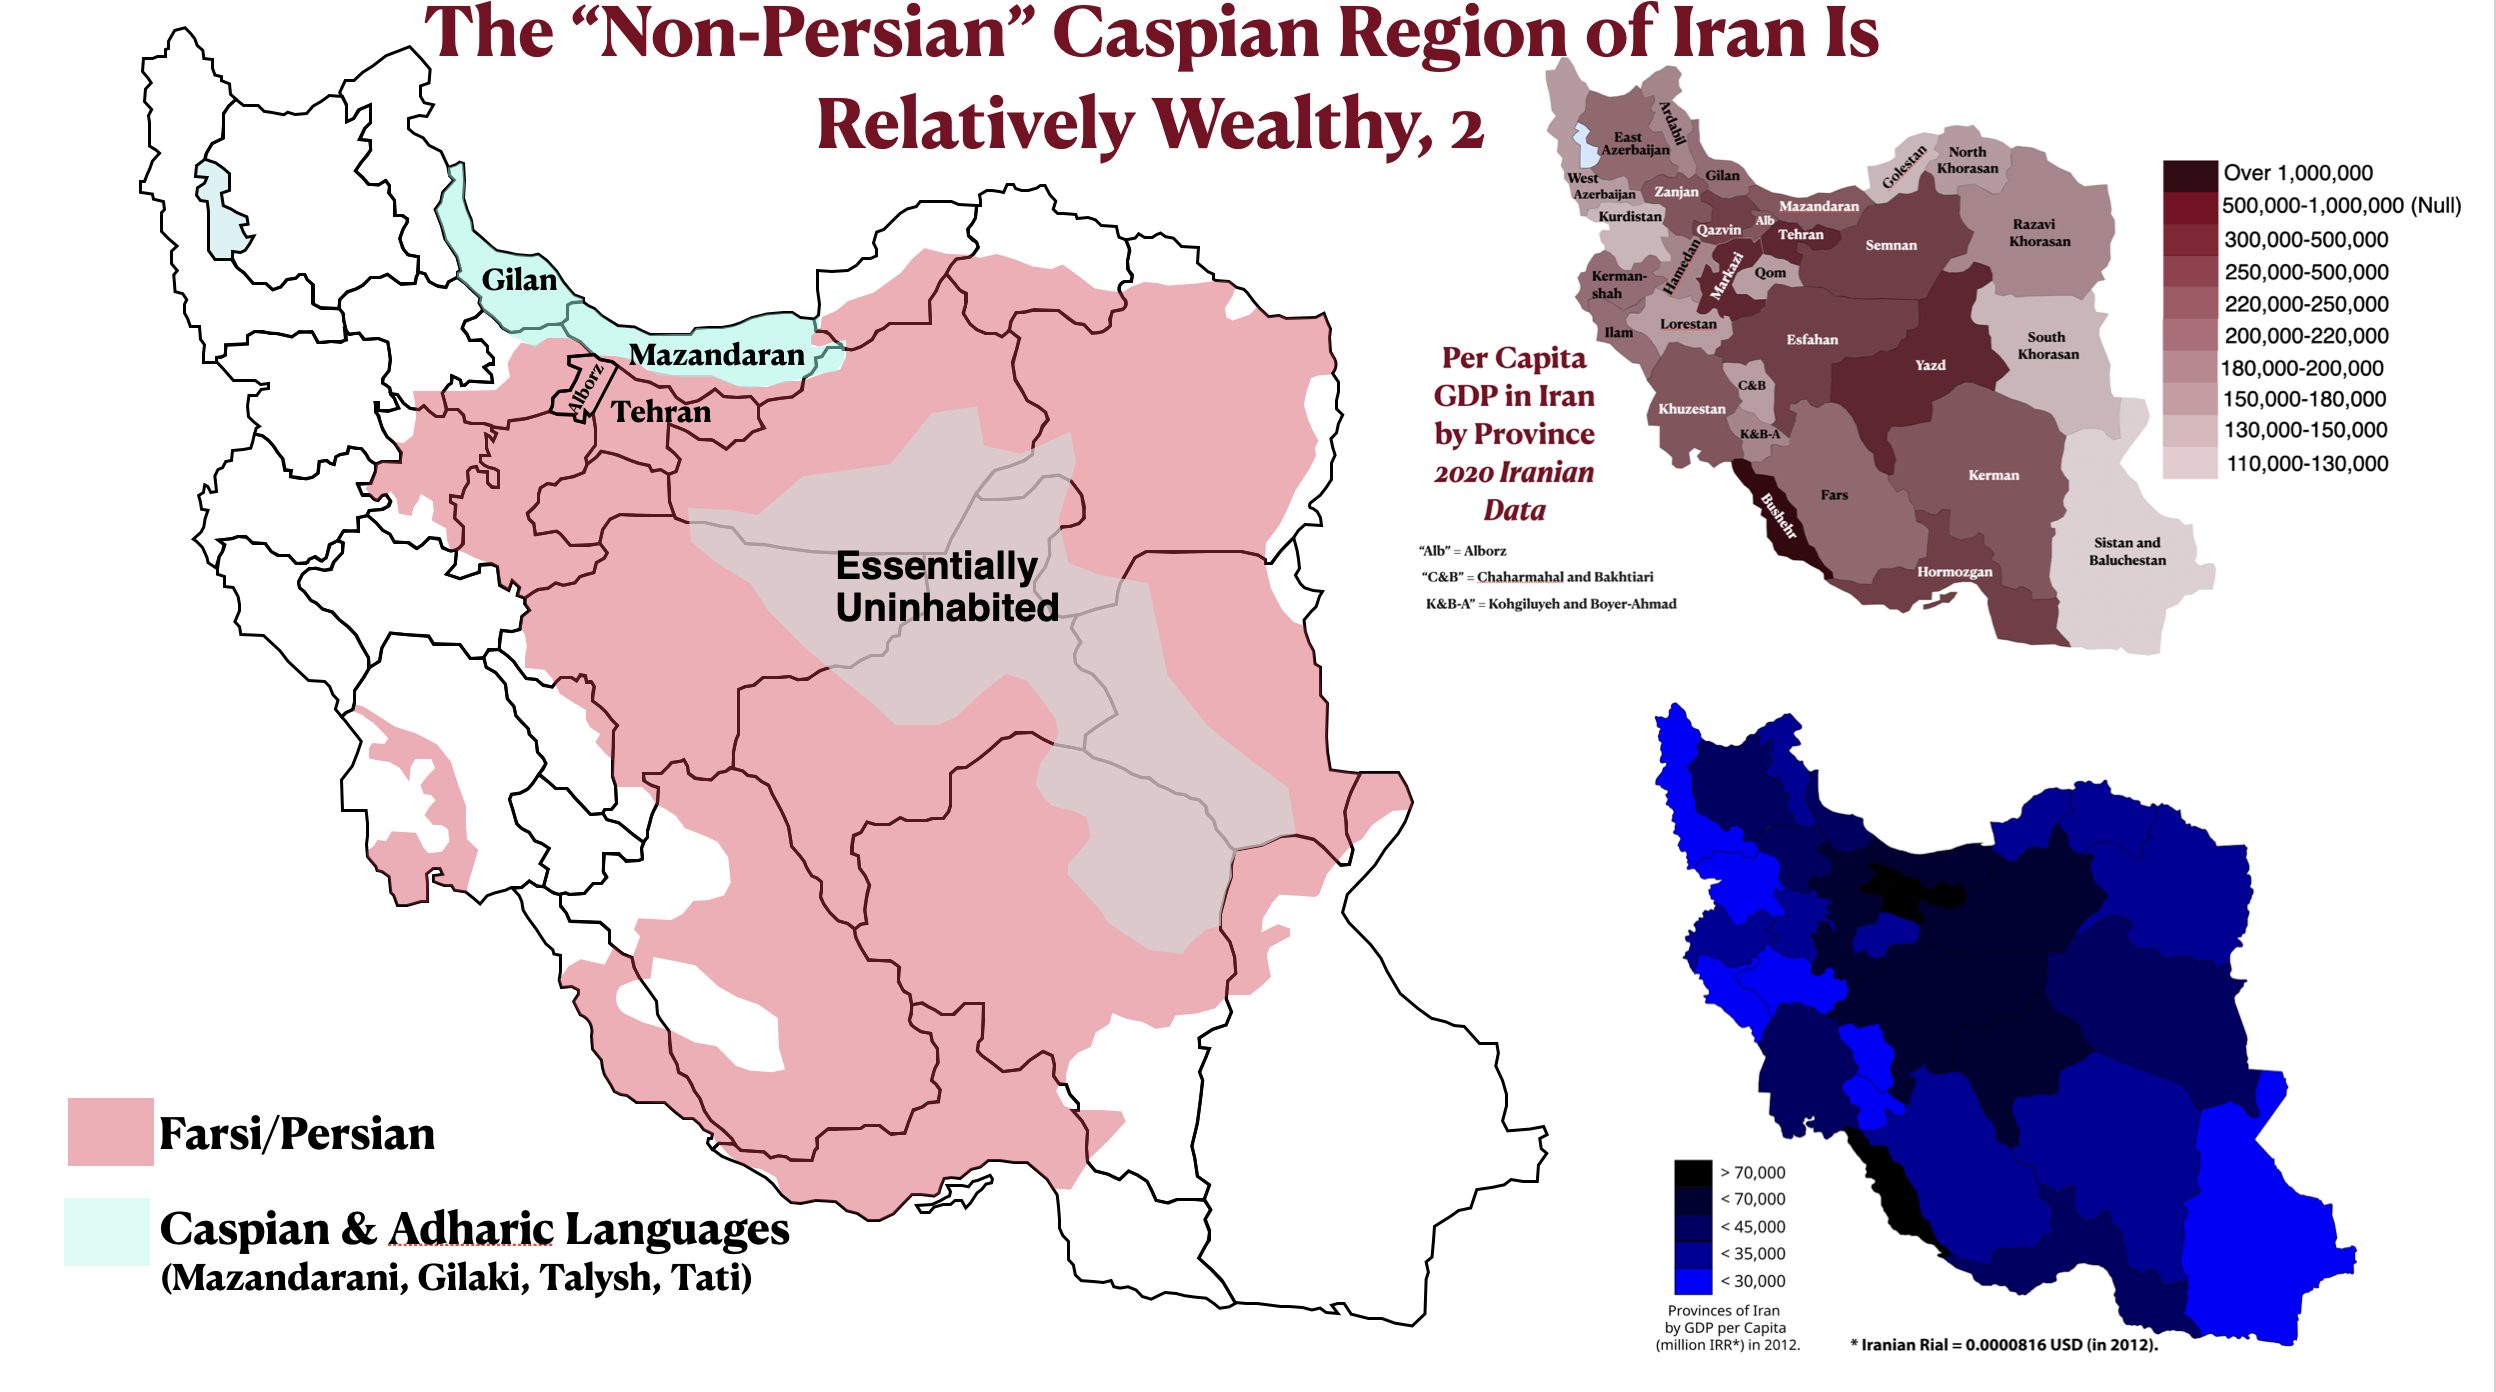
The rest of today’s post examines the relatively prosperous but non-Farsi-speaking Caspian region of north-central Iran. As the per capita income map shows, the largest contiguous block of counties in the highest per-capita-income category is found in north-central Iran. This relatively prosperous region is anchored by Tehran and Alborz provinces, Iran’s political and economic core. But it also extends across the formidable Alborz (Elburz) mountains to encompass Mazandaran province on the south shore of the Caspian Sea. Some high-income counties are also found in Gilan Province, located to the northwest of Mazandaran. Mazandaran is also shown on most maps as having higher-than-average per capita GDP.
Iran Caspian Region Mazandaran Average Income Maps
Iran Caspian Region Per Capita GDP Maps
Physical Map of Iran with Tehran, Alborz, and Mazandaran Provinces Highlighted
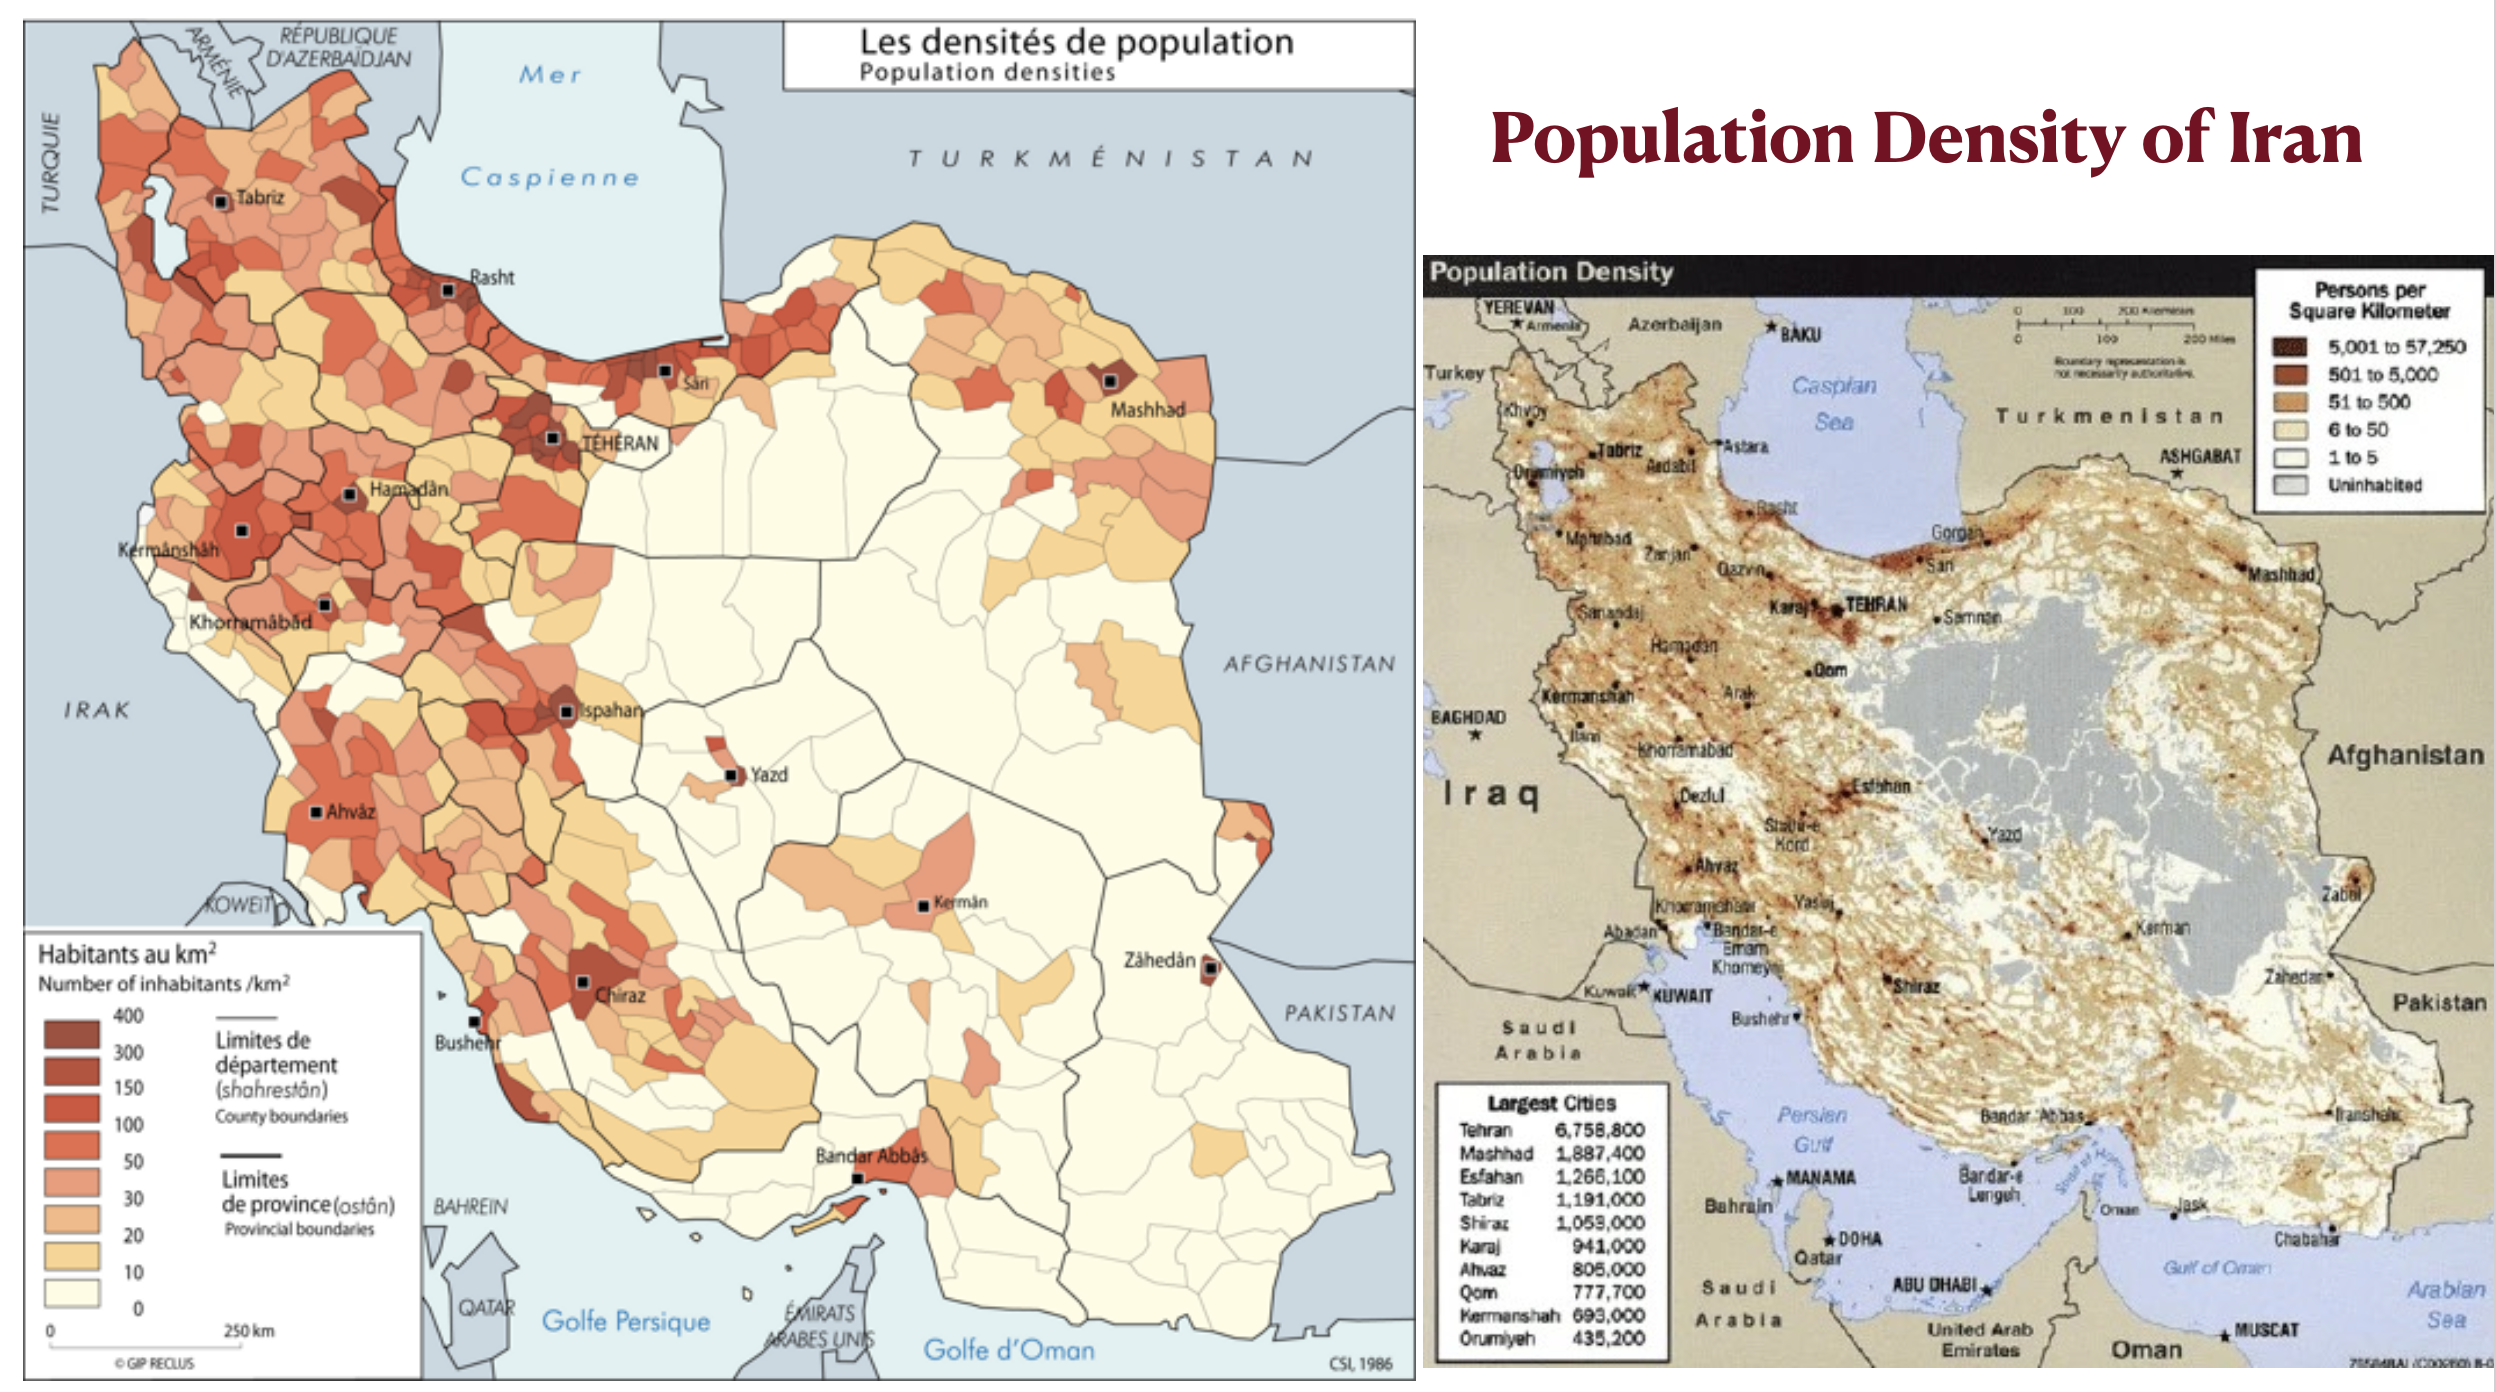
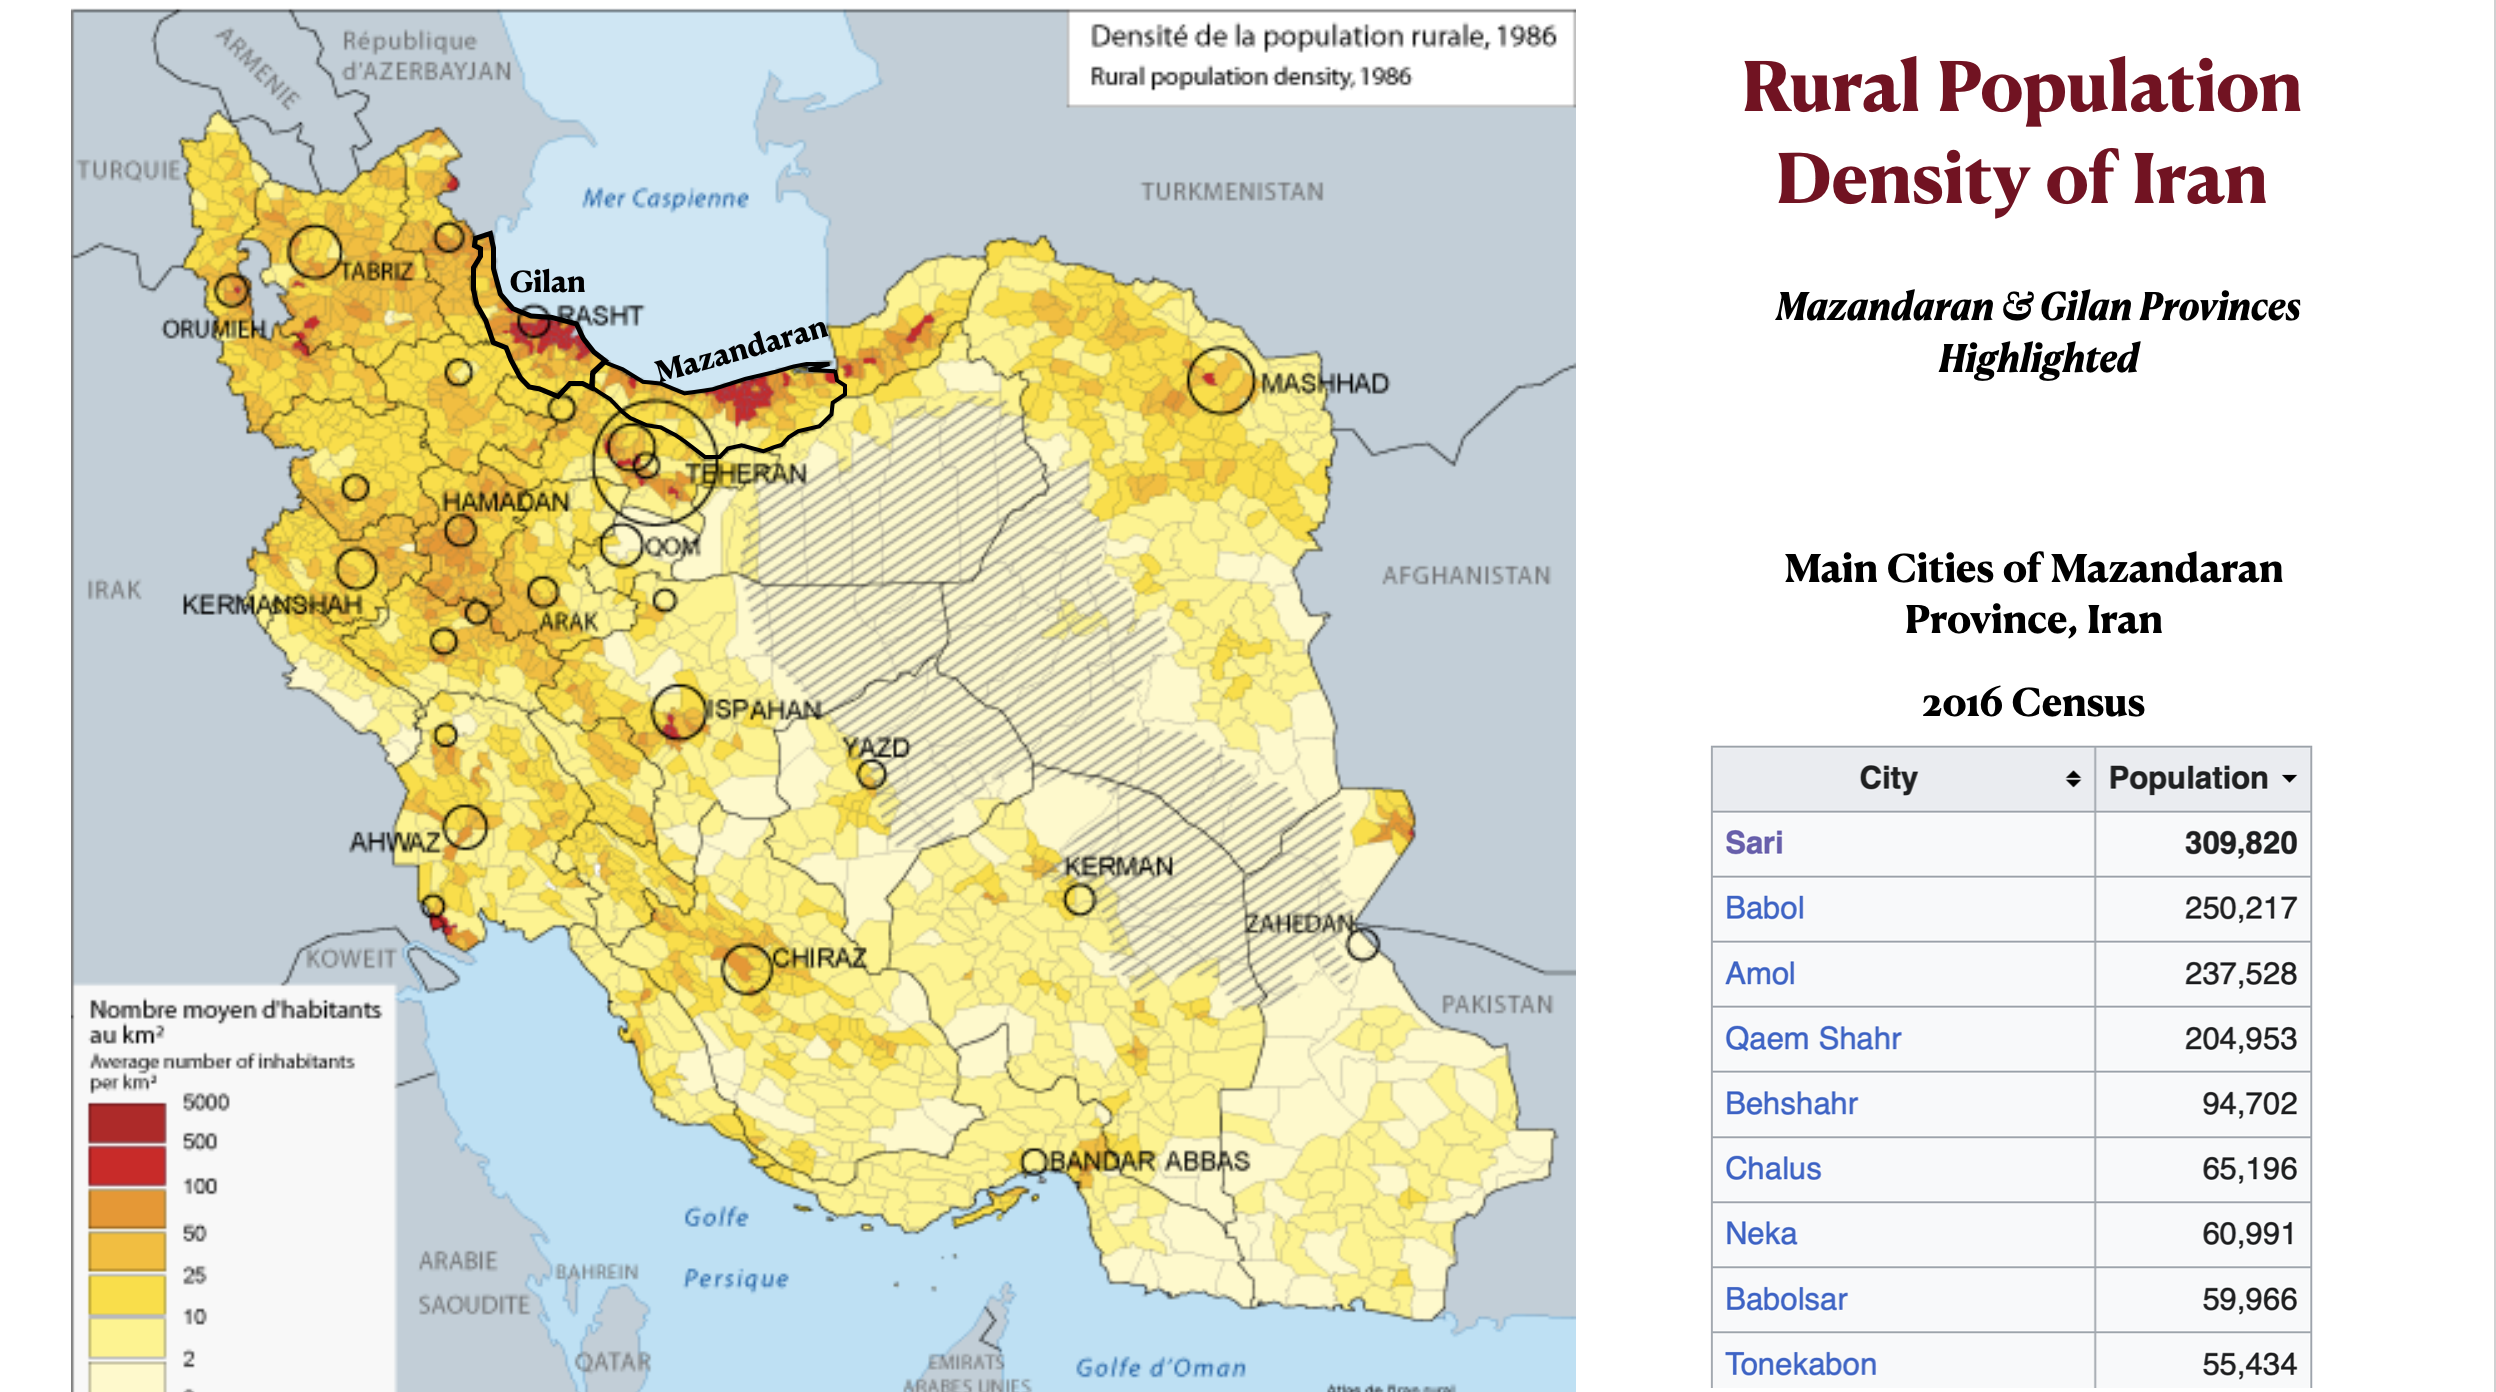
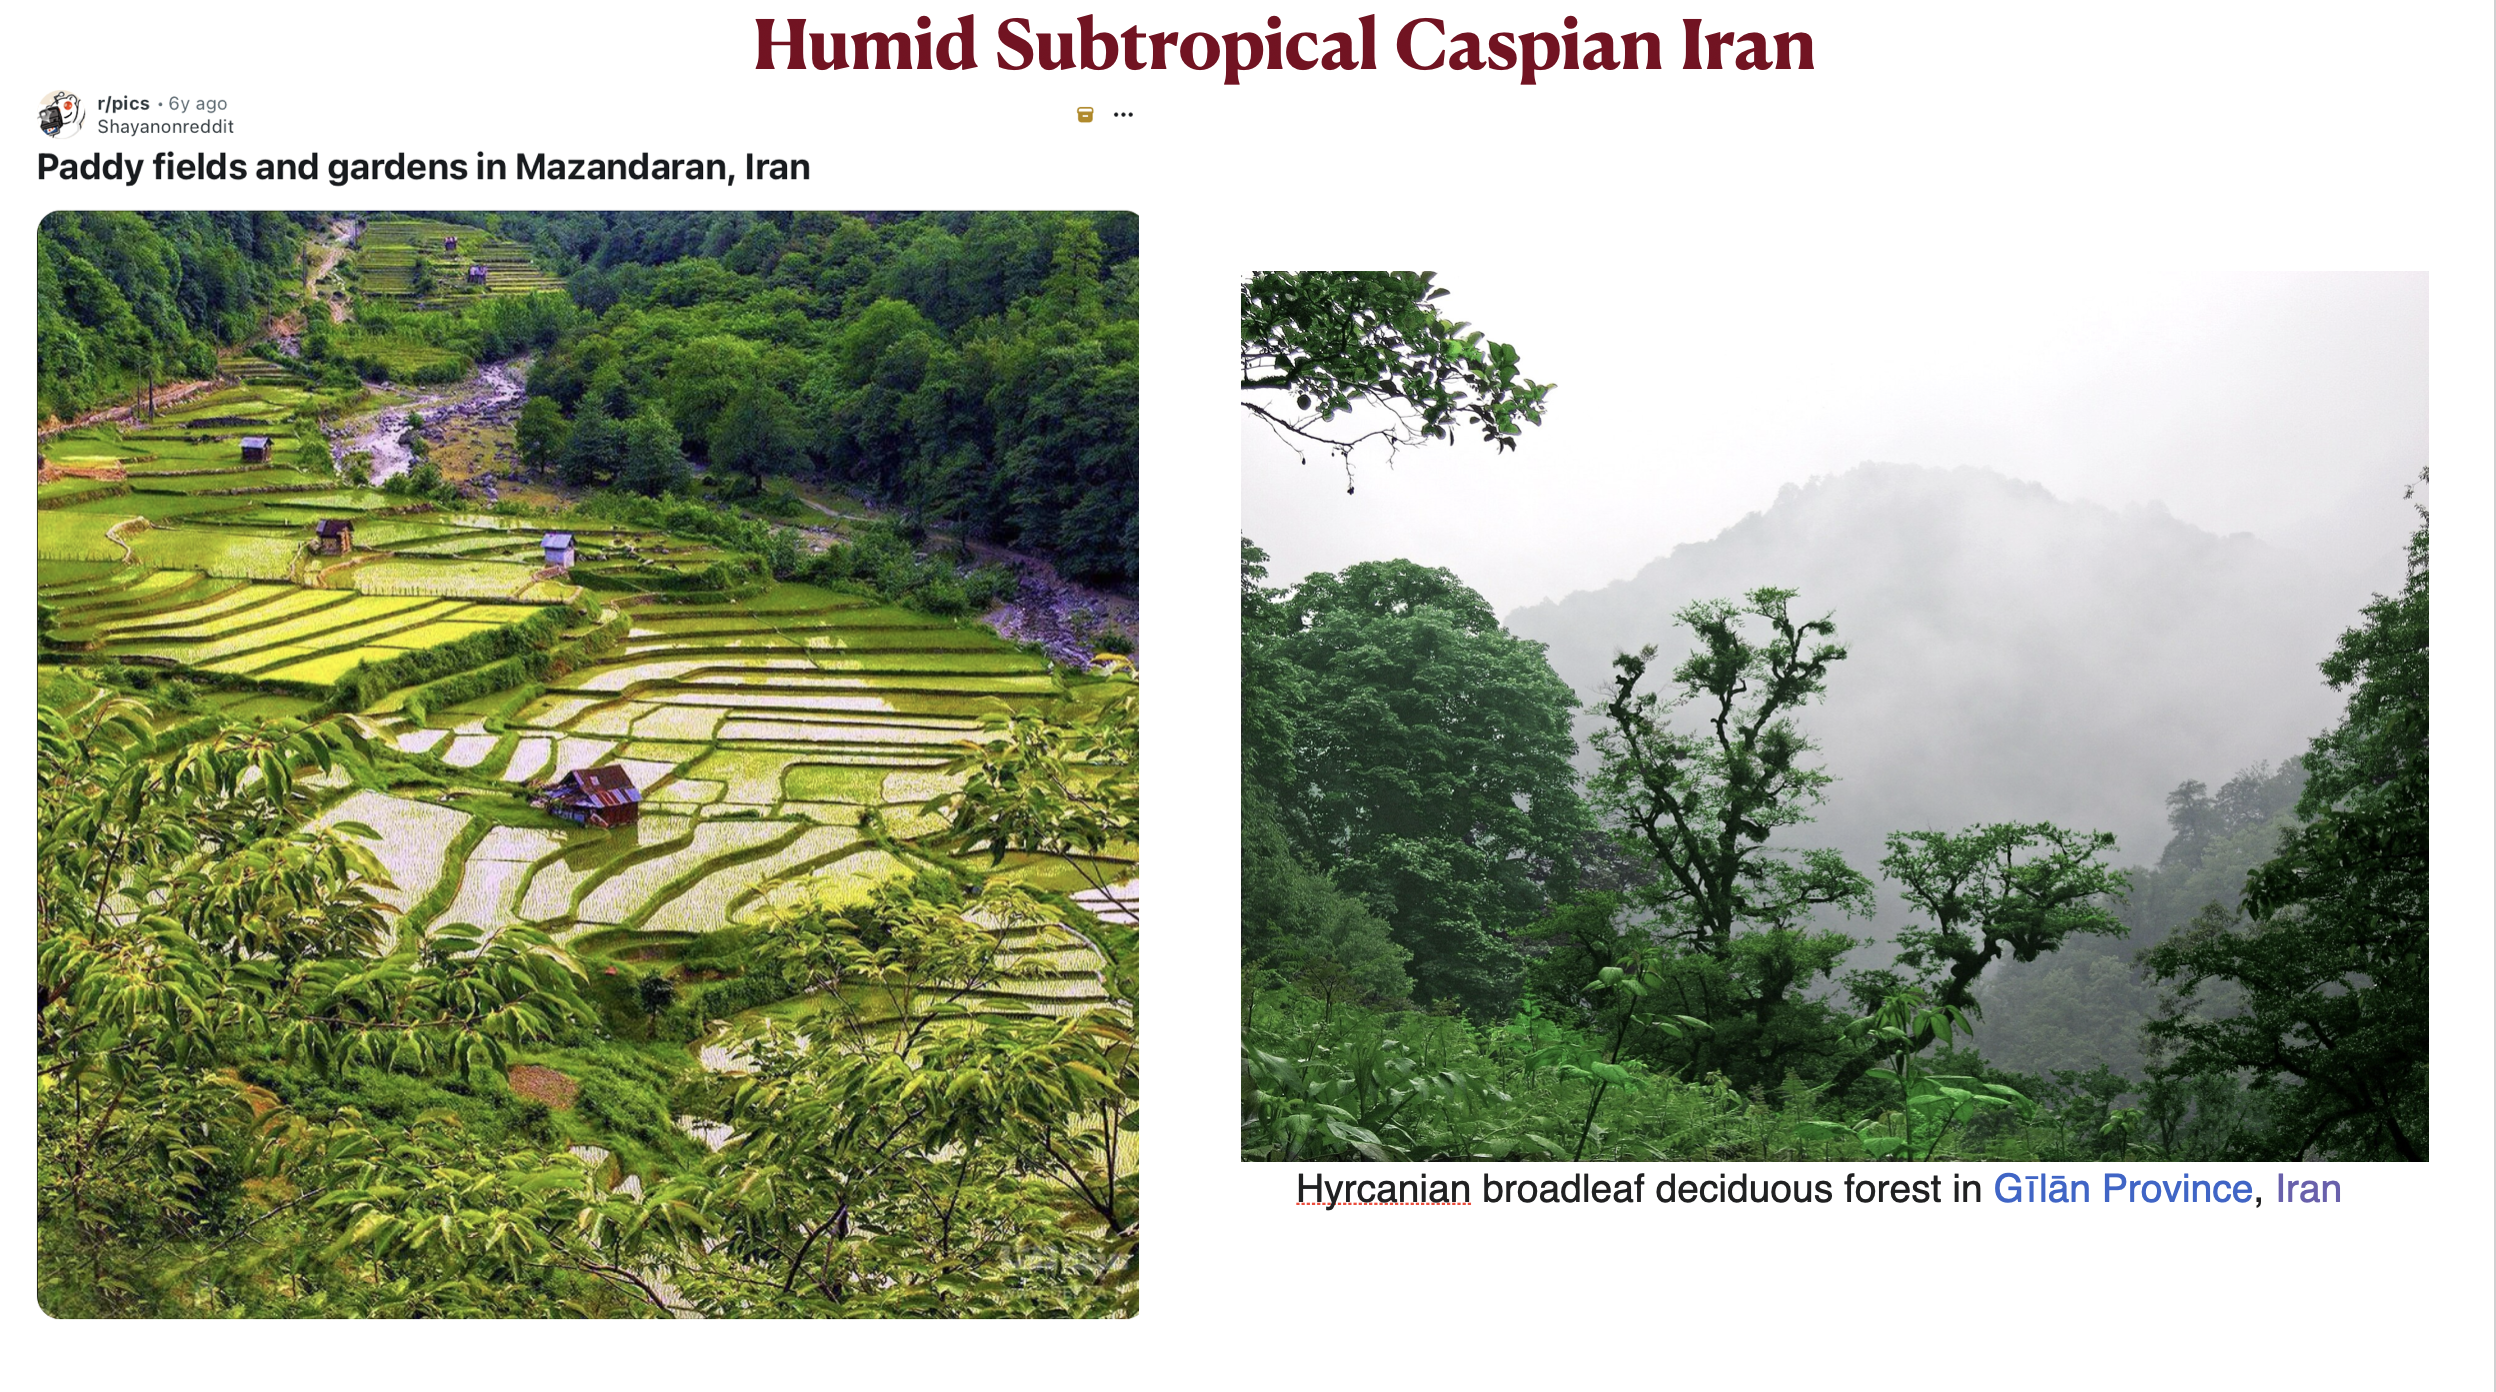
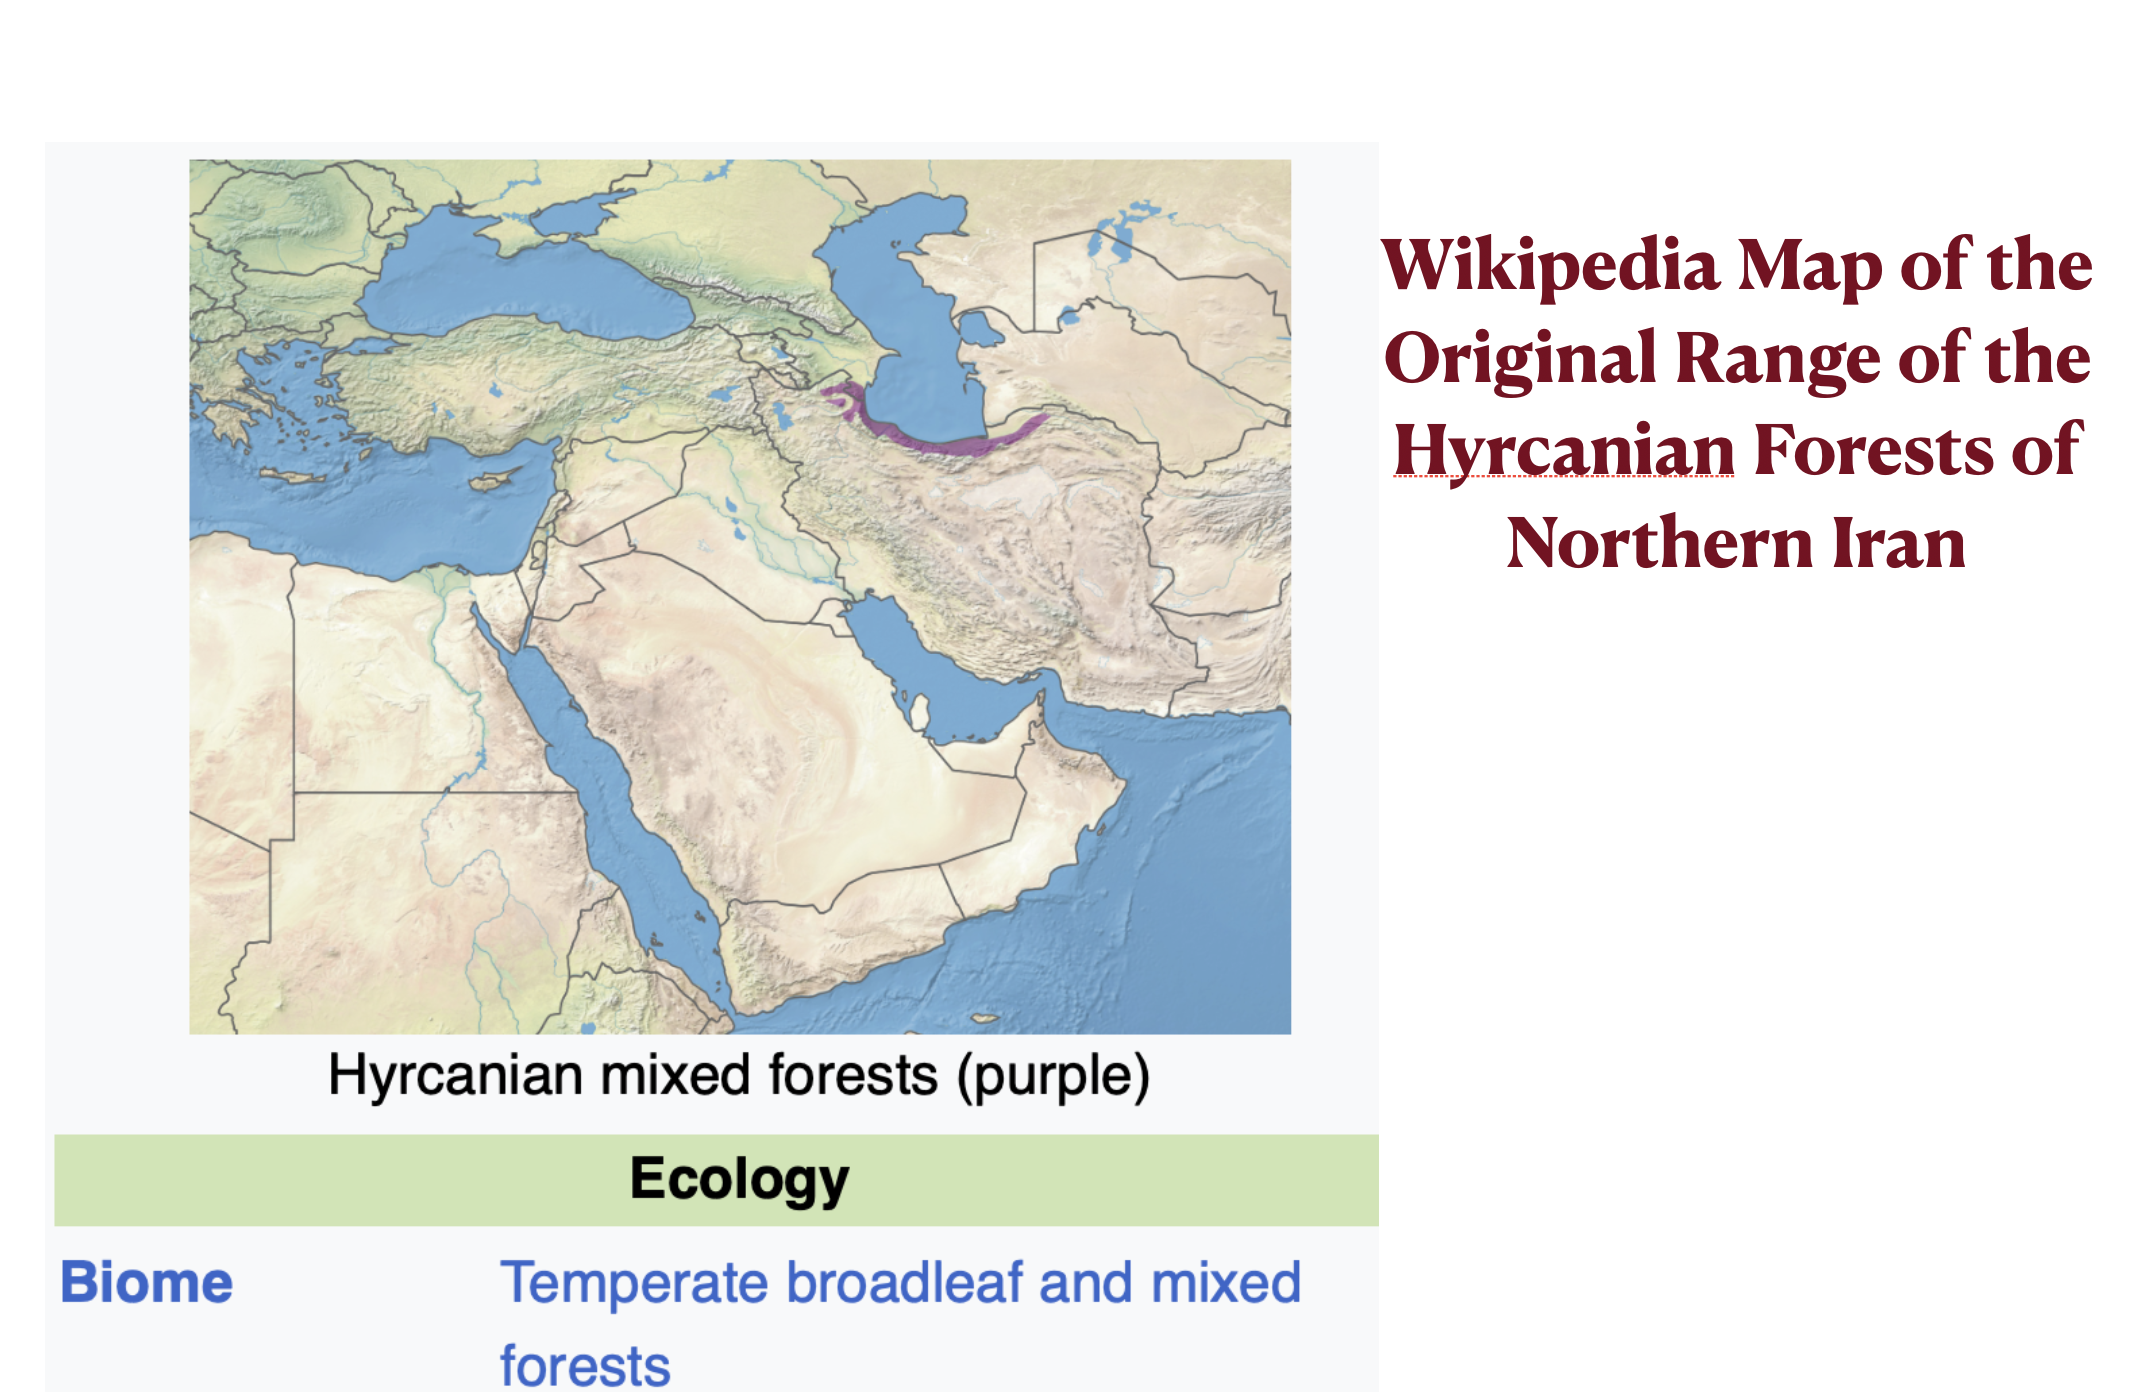
The Caspian region of Iran is highly distinctive and linguistically diverse. Mazandaran has its own language, Mazandarani, which is related to Farsi but far from interintelligible with it. The Caspian coastal plain is densely populated, with the highest rural population density in Iran by a wide margin. Mazandaran province has no large cities, but it does have a well-developed network of medium-sized urban centers. The Caspian region also has a highly productive agricultural economy, focused on rice, citrus and other fruits, vegetables, tea, and aquiculture. Much of this production is only possible because this region, quite unlike the rest of Iran, has a humid subtropical climate. Most of its mountainous areas are covered by lush, broadleaved forests. Until the 1950s, Caspian tigers lived in this region, and leopards still do.
Iran Population Density Map
Iran Rural Population Density Map
Humid Subtropical Caspian Iran
Humid Subtropical Forests of Iran Map
Iran’s Caspian region also has a distinctive political history. It resisted conquest by the Umayyad Caliphate and did not come under Muslim rule until 760 CE/AD, more than a century after the rest of Iran. According to the Wikipedia article on “Tabaristan” (the historical name of Mazandaran):
For a certain period, the Caspian shore of Iran served as a center for ancient Iranian national consciousness. In 783, during a rebellion in Tabaristan, the locals gave up their Arab husbands to the rebels. Dynasties such as the Bavandids and Ziyarids continued to commemorate their pre-Islamic background, with traditional Iranian festivals such as Nowruz and [Zoroastrian] Mehregan continuing to exist in Tabaristan
Long after Islamization, moreover, the Caspian generally remained partly or entirely autonomous, as well as culturally distinctive and sophisticated. The Wikipedia article on Tabaristan also notes that:
The writing tradition of the [Mazandarani] language is approximately as old as that of New Persian. This was due to the long-lasting independent and semi-independent local kingdoms, ruled by the ispahbads
But despite its profound cultural, historical, and environmental differences from the rest of Iran, the Caspian region is still part of the larger core region of the country. Its people consider themselves, and considered by others, to be an integral part of the Iranian nation. Iran’s powerful sense of national identity, in other words, is by no means limited to the Farsi- or Persian-speaking population, as it transcends most language boundaries in the country. The Azeri region of northwestern Iran is also tightly integrated with the Iranian national project, as we will see in the next post.
The previous GeoCurrents post examined critical rankings of the best Bob Dylan songs, which I graphed in terms of Dylan’s age when he wrote the songs in question. In this last of three posts on Dylan, the same technique is used for other rankings of his songs.
The first graph depicts Dylan’s song that have been most-often covered by other musicians, according, that is, to the fallible AI service, ChatGPT. As I contemplated making the graph, I thought that it might take a distinctive shape. That idea was based largely on the prominence of a single song, “Make You Feel My Love,” written relatively late in Dylan’s career (1997). As noted by Wikipedia, “[‘Make You Feel My Love’] is one of the few songs to have achieved the status of becoming a ‘standard’ in the 21st century, having been covered by more than 450 different artists.” The song, however, is not rated as one of Dylan’s best by any of the sources that I had previously consulted. It is, moreover, only the thirteenth most-covered Dylan song – and the only one written after 1973 (according ChatGPT). Overall, the graph of Dylan’s most-covered songs is similar to those based on critical assessments, examined in the previous post. The actual song selection, however, is somewhat distinctive, in that “Forever Young” and “Knockin’ on Heaven’s Door,” both written in 1973, have been covered more often than such critically acclaimed songs as “Tangled Up in Blue,” and “Visions of Johanna.”
Most-Covered Dylan Songs by Year graph
The next figure graphs the favorite Dylan song of some 80 musicians, selected by Stereogum to make such a choice in honor of Bob’s 80th birthday. Again, we see the familiar shape: an early peak followed by a drop then a resurgence, ending with a long tail as Dylan has aged. This graph does, however, have two distinctive features. First, it shows a relatively modest decline in Dylan’s late twenties. The second difference is a surprisingly large number of favorites written when Dylan was in his late seventies. This final peak derives largely from a single song, the almost 17-minute-long “Murder Most Foul.”
Musicians’ Favorite Dylan Song by Year graph
I could not resist graphing my own favorite Dylan songs for the final figure. I am unqualified to make such a list, and I would never claim that it represents anything like his “best” works – such an assessment, in my view, is one that only Dylan himself is qualified to make. At any rate, I found it relatively easy to pick my five favorite songs, but after that the process became increasingly difficult. I anticipated that the resulting graph would also have an unusual shape, as I tend to like the songs that Dylan wrote in the late 1970s and early 1980s more than most critics do. As it turned out, however, my graph follows the familiar curve, albeit with a larger-than-usual hump lasting from the early 1970s through the early 1980s. The fifty songs that I selected for graphing are listed in a figure at the end of this post.
GeoCurrents’ Favorite Dylan Songs by Year Graph
For what it’s worth, my top Dylan songs are: “Where Are You Tonight (Journey Through Dark Heat”) (1978); “Tangled Up in Blue” (1974); “Blind Willie McTell” (1983); “Like a Rolling Stone” (1966); and “Every Grain of Sand” (1980”). “Tangled Up in Blue” and “Lke a Rolling Stone” rank high on almost every list of the best Dylan songs, and both “Every Grain” and “Blind Willie McTell” appear in high positions on many. But my favorite Dylan song – indeed, my favorite song – rarely makes the cut. It does appear in The Rolling Stone’s 100-song list, but only in the 97th slot. I was therefore pleased to see that one noted musician, Craig Finn of The Hold Steady, picked this gripping and intensely emotional song as his favorite. As he writes:
Today my favorite Dylan track is “Where Are You Tonight (Journey Through Dark Heat).” The closing track on Street-Legal begins with funky percussion before sliding into an easy groove. And it is this part that I love especially — the comfort and confidence of Dylan already deep in an astonishing career fronting a band with this knowing soulfulness. I’ve been listening to this song for many years, and I still don’t know what it’s exactly about, but it seems to mix the modern and personal with the ancient and biblical. Thus it comes off as a piece about all of it, a sweeping arm gesture at everything from birth to potential afterlife, shooting off as spokes and paths from the trailhead of a seemingly benign beginning couplet: “There’s a long distance train/ Rolling through the rain.” And while the parenthetical “Journey Through Dark Heat” comes closest to capturing the essence of the song, the main title and refrain asks one of this life’s most pertinent and important questions to listeners, lovers, friends, and fellow humans: “Where Are You Tonight?”
The album on which this song appears, Street-Legal, is also one of my favorites, even though it was generally panned by critics when it was released. More recently, however, the album been rising in critical assessment; in 2019, for example, Nick Tavares wrote about the “blinding, belated brilliance of Bob Dylan’s Street-Legal.” In my own (unqualified) opinion, Dylan reached his peak in the three-album sequence issued from 1975 to 1978: Blood on the Tracks, Desire, and Street-Legal. This run would have been even better if the distasteful song “Joey” been dropped from Desire and replaced with the sublime “Abandoned Love,” which had been recorded for the album but was not included on it. (The rejection of “Blind Willie McTell” from Infidels is even more baffling.)
As a final note, I value many of Dylan’s evangelical songs, written when he was in his late thirties and early forties, more than most of his fans and critics. For this stage of his career, I often prefer covers, a preference that many of Dylan’s most devoted fans would view as anathema. For what it’s worth, I favor Liz Wright’s rendition of “Another Grain of Sand,” Elkie Brooks’ version of “The Groom’s Still Waiting at the Alter,” and Sinéad O’Connor’s take on “I Believe in You.”
In a recent lecture on declining birthrates, I mentioned pronatalist worries about a corresponding decline in our ability to solve problems and address crises, due mainly to the aging of the population. Creative thinking, according to this argument, is primarily an attribute of youth. Most environmentalists find this thesis unconvincing if not absurd. Creativity, they contend, is not limited to youth, and that even if it were, there will still be enough young creative minds even in countries with the lowest birthrates.
The idea that an aging society might be hobbled by a decline of creativity and vigor is not a fringe position, nor is it restricted to conservative pronatalists. Consider, for example, this recent passage from liberal New York Times columnist Nicholas Kristof:
In an aging and perhaps enfeebled world, Africa will also be a continent of youth — arguably making it comparatively vigorous and more of a hotbed for entrepreneurship and for music and popular culture. In a sign of increasing cultural influence, Africans in recent years have won both the Booker Prize and the Nobel Prize in Literature.
The scientific literature on age and creativity is large but no definitive answers have been reached. Some evidence suggests that creativity tends to decline with age in some domains but not in others. In fields in which raw mental power, along with the ability to think outside of established frameworks, are essential, breakthroughs often come early. Mathematics and physics are prime examples: Issac Newton developed calculus in his early and mid-twenties; Alfred Einstein was 26 when he wrote four groundbreaking papers, one of which established special relativity. In contrast, in fields in which the accumulation of knowledge and the honing of judgement are crucial, such as history and literature, age can be an advantage. This distinction is sometimes framed in terms of the difference between “fluid intelligence” and “crystalized intelligence.”
Songwriting is an intriguing area for musing on this question, as it combines the distinctive domains of musical composition and poetry. Poetry might seem to be good example of a field in which experience can be beneficial, but a vast trove of acclaimed poetry has been composed by the young. (John Keats died at 26, Percy Shelley at 29, and even Lord Byron made it only to 36.) Musical composition, in contrast, might seem favor the young, but some of the world’s most celebrated composers retained their powers into advanced age, including Johann Sebastian Bach, Ludwig van Beethoven, and Giuseppe Verdi. All told, one might expect some decline in creativity among songwriters. But – yet again – examples to the contrary are not hard to find. Leonard Cohen recorded his most beloved song, “Halleluiah,” in his late 40s, and his three final and widely celebrated albums were produced when he was in his late seventies and early eighties.
Yet when I casually consider the works of songwriters who came to fame in the 1960s and ‘70s and remained active for decades, most seem to have experienced some dimming of their creative spark as they aged. At 82, Paul McCartney continues to produce quality work, and he recently announced that he been “working on a lot of songs” that he hopes to finish and record in 2025. But I doubt that many critics would claim that his post-Beatles output, produced over 54 years, shows more creativity than the songs that he recorded with the Beatles over an eight-year period. (McCartney did, of course, share songwriting credit with the equally brilliant John Lennon in his early and mid-twenties, but most of the Beatles songs that he sang were essentially of his own creation.) As creativity declines, moreover, songwriting effort seems to increase. If I recall correctly, Paul Simon once said that in his youth songs simply poured out, whereas the older he became, the harder he had to work.
Bob Dylan makes an excellent case to consider the relationship between age and songwriting creativity. Dylan is widely regarded as the greatest songwriter of our time – if not of all time – and his output is vast (over 600 songs). He has worked in many genres yet is highly distinctive. He also continues to receive critical acclaim for his new songs. In 2021, 80 relatively well-known musicians were asked to name their favorite Dylan song to honor his 80th birthday, and five picked something from his 2020 album, Rough and Rowdy Ways. But as creative as he still is, I do see a descent over time. I also think that most critics and fans would agree.
This hypothesis might be testable, and least to some minimal degree. Many assessments have been made of Dylan’s greatest songs, by critics and others. The songs that are so acclaimed might serve as a reasonable proxy for his creativity, allowing one to graph his best output against his age (see the figures posted below).
Although the sources that I consulted vary significantly in the songs that they selected, the general pattern is clear. Dylan – in the imaginations of those who assess him – peaked in his early and mid-twenties. (As Joan Baez memorably put it, he “burst on the scene already a legend.”) The ranking of his work then plummets when he reached his late twenties, only to rebounded in his early and mid-thirties. But according to the critical consensus, he would never regain his previous heights. By his 40s, according to most sources, Dylan was writing few if any great songs. Although many critics have opined that he “returned to form” in his mid-50s, few of his songs from that period – and beyond – make the lists of his best. The general consensus seems to be that Dylan’s output from his early and mid-twenties outweighs everything that came later.
To sum it up, most observers agree that Dylan has experienced creative decline with age. But it is equally important to note that the downward slope has not been even, and that he has remained an impressively creative songwriter to this day. Youth helps, it would seem, but other factor are always at play. Dylan’s artistic decline in his late twenties, for example, may have had less to do with a drop in creativity than with devotion to family life. Consider, for example, these sweet but unremarkable lyrics from “Sign in the Window” (1970):
Build me a cabin in Utah
Marry me a wife, catch rainbow trout
Have a bunch of kids who call me “Pa”
That must be what it’s all about
That must be what it’s all about
The first graph is derived from asking ChatGPT to list Dylan’s “best songs by critical consensus.” I start with AI because it tends to give a bland overarching view, derived from numerous sources. The list that it provided clearly shows the pattern that I described above, albeit without the “long tail” found among the more knowledgeable and perceptive critics. The next figure purportedly graphs the collective assessment of “Dylan fans.” The same pattern is seen, although in simplified form. Ditto for the next two graphs, each of which is limited to his ten best songs.
The next set of figures are derived from longer lists. That of ShortList is somewhat unusual in showing a clear peak in his mid-twenties, relatively little resurgence in his thirties, and a long tail as he aged. One37PM, in contrast, has Dylan peaking in his early twenties. American Songwriter does so as well, and includes only one song written after his mid-thirties. Music Grotto also has an attenuated tail, but does contain one recent song (“Murder Most Foul”). In contrast, Paste includes many songs written after 1980. It also shows a smaller-than-usual decline in his late twenties, and rates the work of his early and mid-thirties at a higher-than-average level.
Rolling Stone has the most comprehensive list, as is fitting for a publication named after one of Dylan’s most famous songs (“Like a Rolling Stone,” which it places in the top slot). The overall pattern that it depicts, however, is fairly typical. Rolling Stone does, however, include a higher percentage of songs written in the early 1980s than is usual, as this is generally seen as the low point in his career. (The songs in question are: “The Groom’s Still Waiting at the Altar” [1980]; “Someone’s Got a Hold of My Heart” [1983]; “Sweetheart Like You” [1983]; “Jokerman” [1983]; and “Blind Willie McTell” [1983].)
Dylan’s 1997 album Time Out of Mind is regarded by many critics as marking a significant reappearance of excellence after years of disappointing ventures. As the Wikipedia article on the album notes:
For many fans and critics, the album marked Dylan’s artistic comeback after he appeared to struggle with his musical identity throughout the 1980s … .Time Out of Mind is one of Dylan’s most acclaimed albums, and it went on to win three Grammy Awards including Album of the Year in 1998.
But while a few songs from Time Out of Mind appear on several of the longer lists graphed below, the period in which it was written does not really stand out on these figures. There may have been a “return to form,” but it was evidently nothing like the form that he had reached in his early and mid-twenties.
(Several clarifications must be said about the graphs posted below. First, the age categories are based on the year in which he wrote the song in question, not the year in which it was recorded or released. Songs on the celebrated album Blood of the Tracks are conventionally dated to 1975, but most were written in 1974. The time brackets that I employ, dividing the decades of Dylan’s career into three segments, are of unequal length: four years for the “early” portion of each 10-year span, and three years for the “mid” and “late” portions. (I think it is safe to assume that most of us regard persons aged 20, 21, 23, and 23, as being in their “early” twenties, with “mid-twenties” reserved for those aged 24, 25, and 26, and so on.) Also to note is the fact that breaks on the graph often fail to correspond with breaks in Dylan’s style. His early electric songs, such as “Subterranean Homesick Blues” and “Maggie’s Farm,” are graphed as being from his early twenties, as they were written in 1964 when he was 23, although they were released in 1965 and are associated with his mid-twenties phase, the origin of which is chronicled in the second half of the recent film, A Complete Unknown.)
ChatGPT List of Best Bob Dylan Songs Graphed by Dylan’s Age
StudyFinds List of Best Bob Dylan Songs Graphed by Dylan’s Age
UCR List of Best Bob Dylan Songs Graphed by Dylan’s Age
Singersroom List of Best Bob Dylan Songs Graphed by Dylan’s Age
ShortList List of Best Bob Dylan Songs Graphed by Dylan’s Age
One37PM List of Best Bob Dylan Songs Graphed by Dylan’s Age
American Songwriter of Best Bob Dylan Songs Graphed by Dylan’s Age
Music Grotto List of Best Bob Dylan Songs Graphed by Dylan’s Age
Paste List of Best Bob Dylan Songs Graphed by Dylan’s Age
Rolling Stone List of Best Bob Dylan Songs Graphed by Dylan’s Age
Watching the superb and sublimely acted recent film A Complete Unknown has inspired me to revisit the songs of Bob Dylan. In doing so, I have once again been impressed with his geographical vision, marked by effective invocations of place. His frequent use of place names in lyrics has even drawn cartographic attention, as can be seen in figure posted below. (Although impressive, the map does not seem to capture all the places that Dylan has mentioned in his songs; Ashtabula in northeastern Ohio, for example, is apparently missing.*)
Slate Map of Bob Dylan Songs
Dylan achieved fame as a songwriter in part by drawing on, and synthesizing, a remarkable range of musical traditions. Although he initially gained attention for folk music, the blues genre has arguably been a greater influence over the course of his career. The album that he was working on in the second half of the film signals as much in its title: Highway 61 Revisited. Highway 61 (officially, U.S. Route 61) is often known as the “Blues Highway,” as it wends its way through the land of the Delta Blues in the Inland Delta of northwestern Mississippi (not to be confused with the actual delta of the Mississippi River – the so-called Bird’s Foot Delta – in southern Louisiana). Significantly, Route 61, as it was originally constituted, stretched from New Orleans to Duluth, Minnesota, Dylan’s birthplace, and beyond. Its northern reaches are not far from Dylan’s hometown, the small mining city of Hibbing in the Mesabi Iron Range.
Highway 61 Blues Highway Map
Mississippi River Delta and Inland Delta Map
Intriguingly, Dylan implies a journey from one end of Highway 61 to the other in his acclaimed song “Tangled Up in Blue,” generally regarded as a fictionalized, semi-autobiographical account:
I had a job in the Great North woods
Working as a cook for a spell
But I never did like it all that much
And one day the axe just fell
So I drifted down to New Orleans
Where I was looking for to be employed
Working for a while on a fishing boat
Right outside of Delacroix
Dylan’s choice of Delacroix, a town of 48 residents (in 2000), is also intriguing. Locally called “The End of the World” (originally “El fin del Mundo”), Delacroix was originally settled by Isleños, Spanish-speaking people from the Canary Islands. It is also known for the annual blessing of its fishing fleet.
Delacroix End of the World
One of the early scenes in A Complete Unknown features Dylan singing his folk tribute to Woody Guthrie, “Song to Woody,” to Guthrie himself, mute and restricted to his bed, as well as to folk-icon Pete Seager. Although moving and effective, the scene itself is fictional. “Song to Woody” was one of the first original songs that Dylan recorded, but it is never ranked, to my knowledge, as one of his best. It is a different story, however, with his 1983 homage to Willie McTell, a Georgia-born practitioner of the Piedmont Blues, described in his Wikipedia article as “singing in a smooth and often laid-back tenor, which differed greatly from the harsher voices of many Delta bluesmen …” Although relatively little known, in large part because Dylan was unsatisfied with the recording and only released it years later on a “Bootleg” album, “Blind Willie McTell” is now regarded by many critics one of Dylan’s best songs. Greil Marcus goes so far as to rate it as his greatest recording, provided, that is, if the listener is in “the right mood.” I would unreservedly put it among his top five. As commentator michaelg4411 pithily summarizes it on a YouTube offering of the song, “Hundreds of years of American history distilled into a six-minute masterpiece. Stunning.”
* Mentioned in “You’re Gonna Make Me Lonesome When You Go”: “I’ll look for you old Honolulu, San Francisco, Ashtabula.”
Western Cape is South Africa’s most politically distinctive region by a wide margin. It is the only province that has never given majority support to the African National Congress (ANC). In 2024, it gave less than 20 percent of its vote to the ANC, awarding 53.4 percent to the centrist, non-racialist Democratic Alliance, which has long dominated the province. As the second map posted below shows, every municipality in Western Cape gave majority or plurality support to the DA in the 2024 national election, whereas only three municipalities in other provinces did the same. Western Cape’s political differentiation is so pronounced that it supports an active independence movement that sometimes polls above 50 percent.
South Africa 2024 DA Vote by Province Map
2024 South Africa Election Vote by Municipality Map
South Africa’s White community heavily supports the Democratic Alliance, favoring its non-racialist stance. Not surprisingly, Western Cape has South Africa’s largest percentage of White population by a significant margin. But at 16.4 percent, it is still relatively low and as such cannot account for the DA’s success in the province. Instead, most DA voters in Western Cape are members of the mixed-race, Afrikaans-speaking Coloured community. At 42 percent, the Coloured community forms a strong plurality of the population of Western Cape. But the figure is identical in neighboring Northern Cape (see the second map posted below), which gave only 20.9 percent of its vote to the Democratic Alliance and awarded plurality support to the ANC. As it turns out, the two provinces are quite distinctive in other regards. Western Cape has a more productive economy and a higher level of social development. Northern Cape also has a much smaller White population percentage than Western Cape (7.3, as opposed to 16.4) and a significantly larger Black population percentage (50, as opposed to 39).
South Africa White Population by Province Map
South Africa Coloured Population map
But racial identity is not the only factor in determining voting patterns, and none of South Africa’s racial communities votes monolithically. In the 2024 election, many Coloured voters swung to Patriotic Alliance, which was formed in 2013 to favor the interests of their community. As can be seen in the map posted below, Patriotic Alliance took a healthy 7.8 percent of the vote in Western Cape and 8.6 percent in Northern Cape. As its support comes mostly from the Coloured community, its vote-count elsewhere in the country ranged from small to negligible. Nationwide, it took 330,425 votes, a huge increase from the 6,660 votes it received in 2019.
South Africa 2024 Election Patriotic Alliance Vote Map
Wikipedia describes Patriotic Alliance (PA) as a rightwing party, as its name might suggest. But the same article notes that PA’s economic stance is generally centrist. Some of its social policies, moreover, including those on housing and healthcare, tilt to the left. It also aims to reduce South Africa’s wide wealth and income disparities, which is generally viewed as a left-leaning position. But Patriotic Alliance is skeptical of immigration, takes a hardline stance on corruption, wants to reinstate the death penalty, and favors more socially conservative policies. It has also expressed solidarity with Israel in its struggle with Hamas, which is not a popular stance in South Africa’s Black community. Critics of Patriotic Alliance accuse the party of “gangsterism,” noting that its two founders are convicted criminals and contending that party leaders have worked with criminal organizations in an effort to reduce violent crime. Patriotic Alliance leaders have also advocated using veterans of the former Cape Corps, which had been a Coloured military organization, to help control gang violence.
Overall, it is difficult to classify the political position of Patriotic Alliance. It is not alone in this regard. Over much of the world, parties that defy the traditional left/right division are gaining support. A good example is Germany’s new political party Bündnis Sahra Wagenknecht (BSW), which emerged from the far-left but now takes an anti-immigration, populist, and nationalist stance. In the 2024 European Parliamentary election in Germany, BSW took 6.2 percent of the vote, whereas Die Linke (The Left), the party from which it emerged, took only 2.7 percent. Political realignment seems to be rapidly gaining strength in many countries.