
The map of excessive drinking in the United States that was recently discussed in GeoCurrents was originally posted on IntoxiStates.com and is based on information from the CDC’s Behavioral Risk Factor Surveillance System, as packaged by the University of Wisconsin’s Population Health Institute County Health Rankings & Roadmaps (CHR&R). It clearly indicates that Wisconsin has the country’s highest rate of excessive drinking and overtly states that among the many counties of the U.S., Gallatin in Montana occupies the top place. The IntoxiStates map is not dated, but a 2025 map based on 2022 data from the same source paints a different picture. Published in the The Hill, this map puts Montana in the top position and depicts Iowa as also having a higher rate of excessive drinking than Wisconsin. The county-based map from the same article indicates that Missoula in Montana is the ‘drunkest” county, with a 29% excessive-drinking rate. The most recent data from CHR&R’s own website puts both Missoula and Madison counties in Montana ahead of Gallatin, but just barely (26% vs. 25%). The “excessive drinking” data used to make these maps, in other words, change from year to year. More to the point, excessive drinking in Wisconsin does not seem to be nearly as pervasive or unusual as it appears to be on the IntoxiStates map.


The CHR&R’s Montana map is particularly interesting, as it reveals a clear county-level correlation between relatively low rates of excessive drinking and high percentages of indigenous residents. This association is significant, as it contradicts a widely held stereotype. It might not, however, be valid. It would be expected that low levels of excessive drinking would be associated with low levels of alcohol-induced mortality, but that is not what the Montana data indicate. A map of alcohol-induced mortality in Montana in the Covid-year 2021, derived from a map published in a PLOS Global Public Health article, shows a surprising negative relationship between excessive drinking and death by drinking. Another pair of maps indicates that Montana counties with high rates of excessive drinking are significantly healthier than counties with low rates. (Correlation, of course, does not imply causation.)


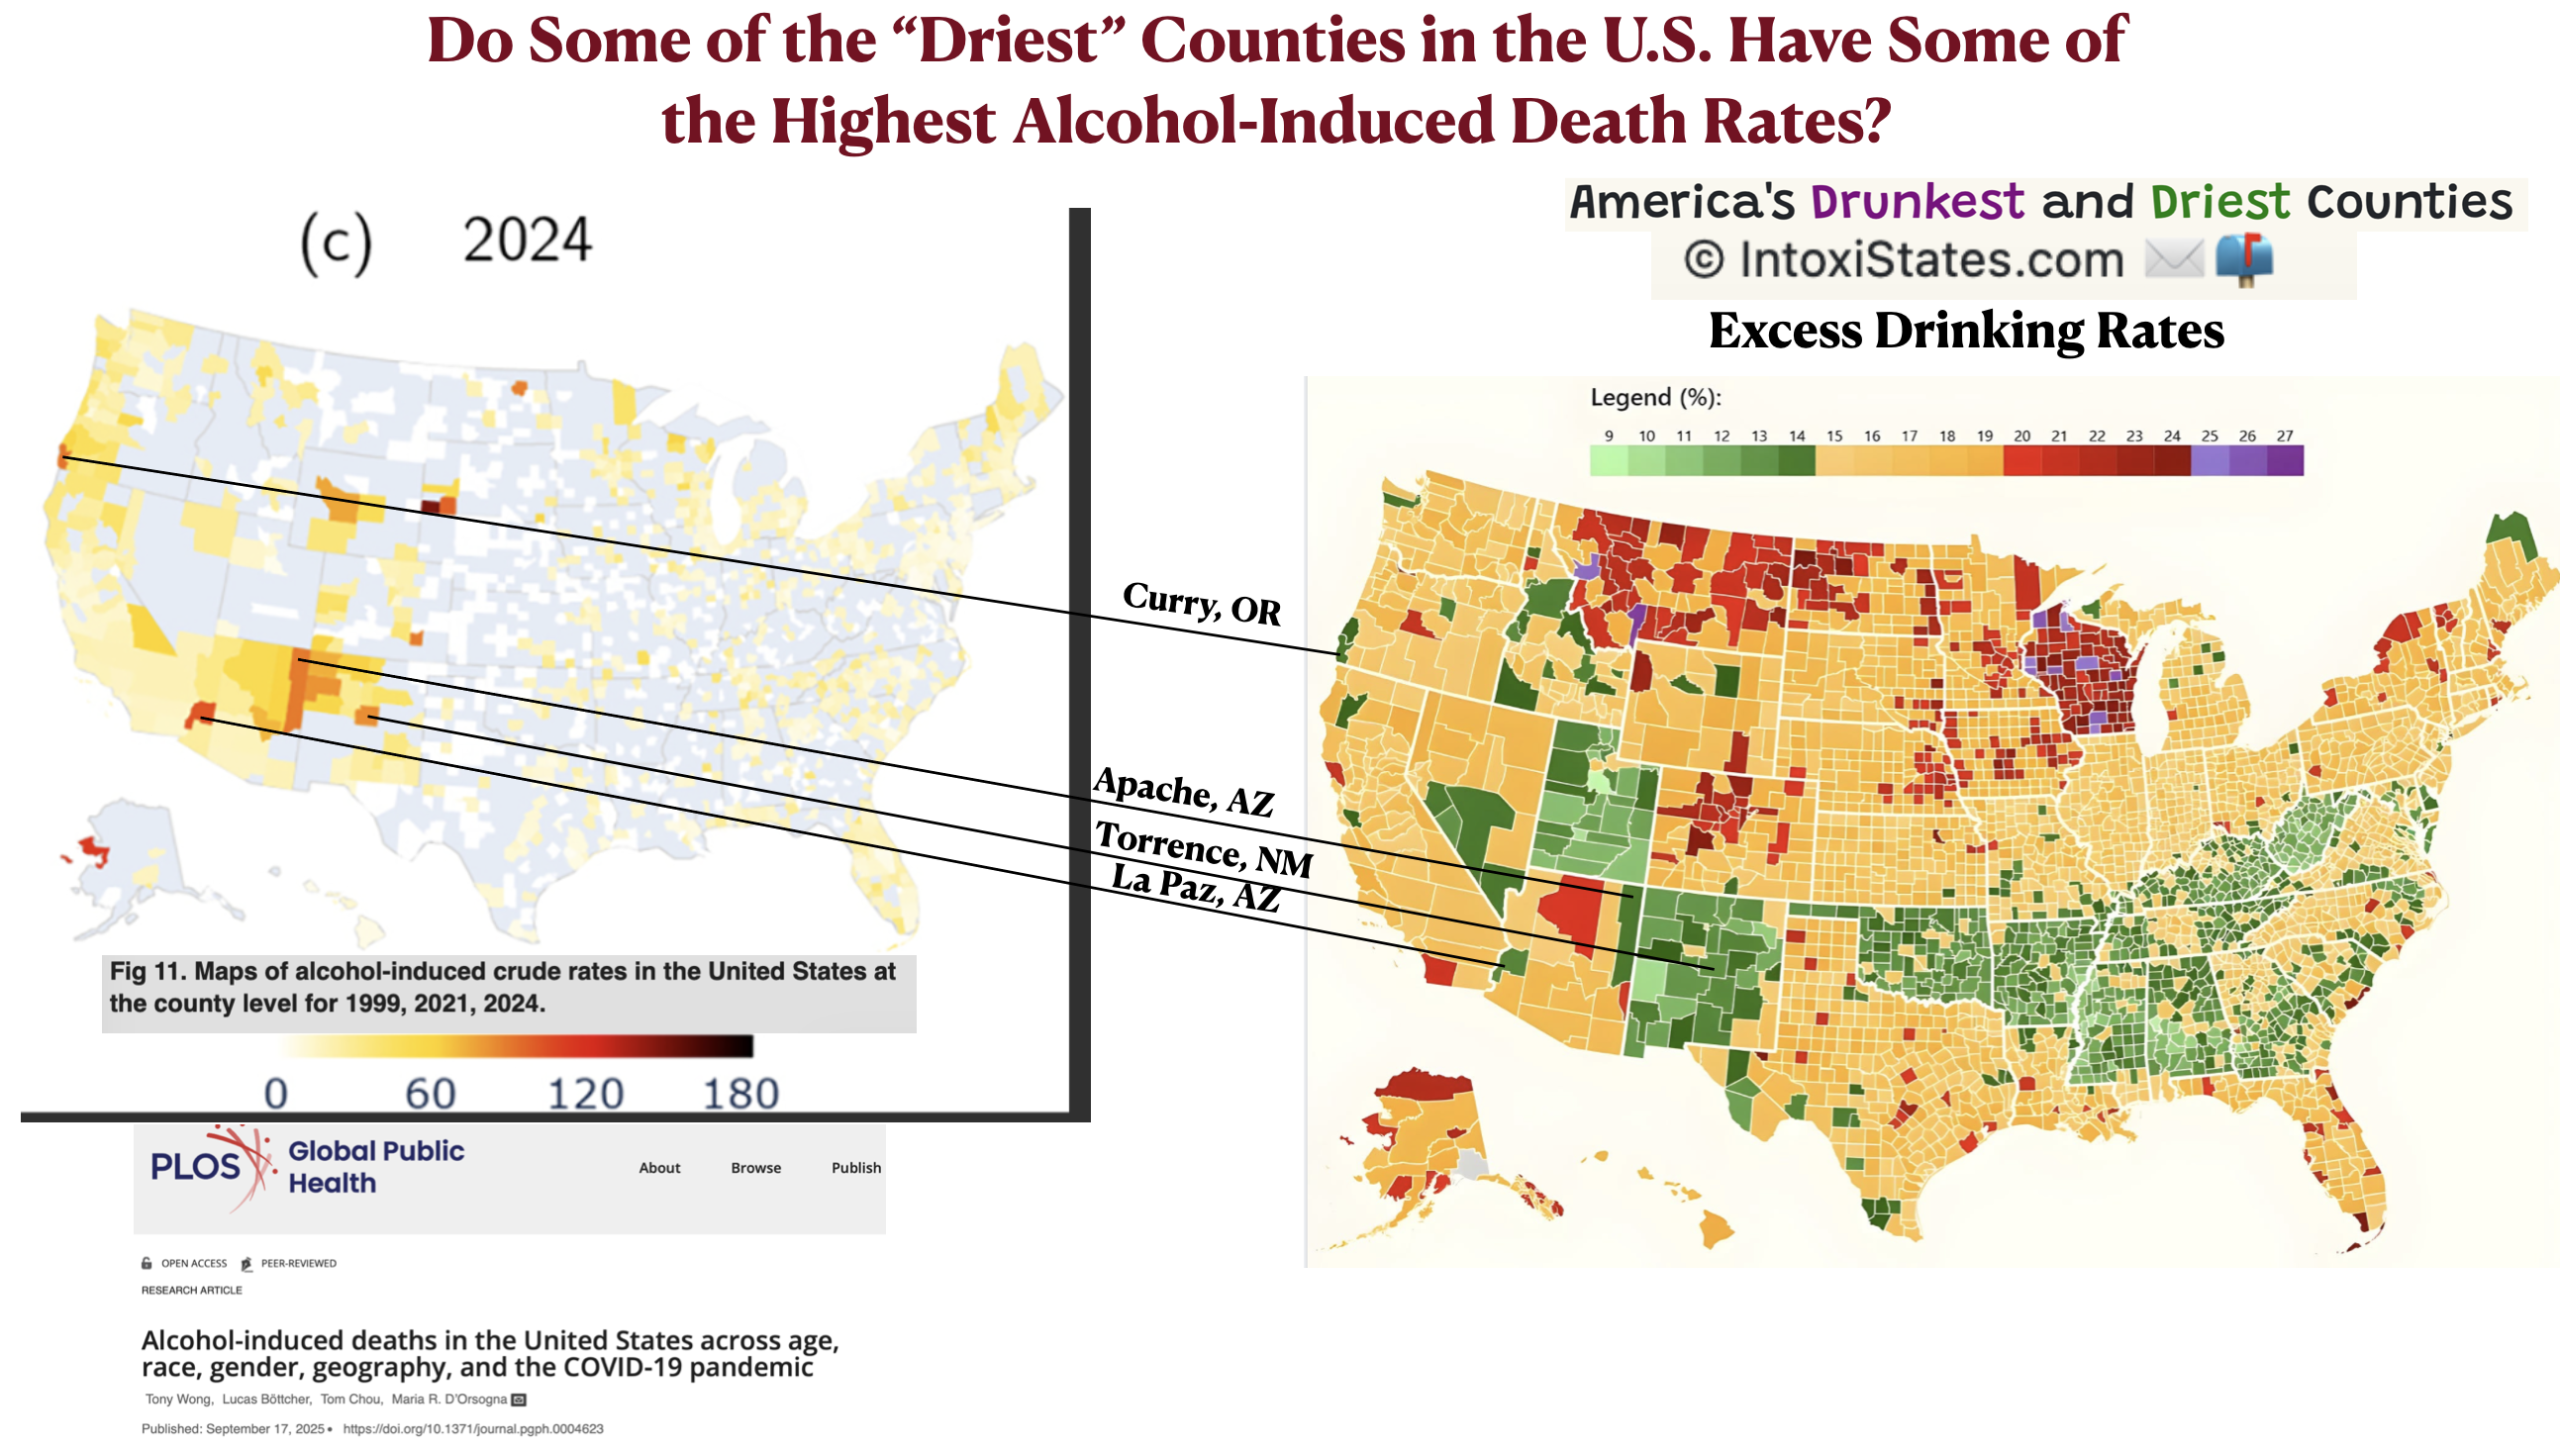
Montana does not seem to be alone in this regard. A pairing of the IntoxiStates map of excessive drinking with the PLOS Global Public Health map of alcohol-induced mortality in 2024 shows that several counties in other states have the same relationship. Curry County Oregon, Apache and La Paz counties in Arizona, and Torrence County New Mexico are all mapped as having low rates of excessive drinking and high rates of alcohol-induced death. Ethnic or racial differences do not seem to be a factor. Curry County is strongly white (83%), Apache County is strongly indigenous (75%), La Paz is highly mixed (61% white alone, 23% Hispanic/Latino, 14.5% American Indian) and Torrence is fairly evenly divided between whites and Hispanics (52% white alone, 42% Hispanic). As the final map in this post shows, many of the “driest” counties located in the interior U.S. south are also among the least healthy.

Such surprising findings indicate that the “excessive drinking” data need to be examined more closely, as will be done in the next GeoCurrents post.