psychoactive substances

Deeper Problems with Maps of “Excessive Drinking” in the United States

Oddly, maps of “excessive drinking” in the United States do not correspond particularly well with maps of per capita alcohol consumption. New Hampshire, Delaware, and Nevada, for example, are typically depicted as having the country’s highest levels of per capita alcohol consumption but only moderate levels of excessive drinking. In contrast, Iowa is usually depicted as having one of the highest levels of excessive drinking but only a moderate level of total alcohol consumption. (Unfortunately, maps of per capita alcohol consumption by county are not available.)

Maps of Excessive Drinking and Total Alcohol Consumption 1

Maps of Excessive Drinking and Total Alcohol Consumption 2

Such a seeming discrepancy can easily be explained by differences in drinking behavior. It is possible, for example, that on average Nevadans drink more than Iowans but generally do so in a more responsible manner, engaging less in “binge drinking.” Possible yes, but probable? I doubt it. I think it is more likely that the data used to make these maps are flawed. In the remainer of this post, I will critically examine the sources used for maps of “excessive drinking.” Admittedly, much of the evidence that I present was derived from “conversations” with AI; as such, my arguments should also be regarded with some skepticism.

The foundation of excessive-drinking maps is the data tabulated by the CDC’s Behavioral Risk Factor Surveillance System (BRFSS), derived from state-based telephone surveys. Sample sizes and exact questions, however, evidently vary by state and year, complicating comparisons over time and space. More significant, honest answers about such problematic behavior cannot always be expected. Supposedly, surveys routinely recover only a fraction of the amount of alcohol that sales data imply, often on the order of 30–60%. Such underreporting supposedly stems from forgotten drinks, underestimated pour sizes, and nonresponses by heavier drinkers. Many respondents, deemed “high impression managers,” want to appear respectable by reporting that they drink less than they actually do. According to one academic study, “high impression managers report 20 to 33% less consumption and are about 50% less likely to report risky drinking.” Such considerations worrisomely suggest that actual rates of excessive drinking are considerably higher than they appear to be on these maps.

But it is also known that the bias can run in the opposite direction, particularly among certain groups of college students for whom heavy drinking can be seen as a badge of belonging. Is it therefore coincidental that counties that are often mapped as having the highest rates of excessive drinking also have large college-student populations, such as Missoula and Gallatin in Montana and Dane in Wisconsin? More to the point, more under-reporting is to be expected in areas in which alcohol is deeply stigmatized (Utah and eastern Idaho; interior regions of the U.S. South) than in areas with alcohol-tolerant cultures (the upper Midwest and much of the interior West).

The definition of “excessive drinking” used in these surveys are also problematic. The CDC definition seems straightforward: either “binge drinking” (four or more drinks on one occasion for women, and five or more for men), or “heavy drinking” (eight or more drinks per week for women, and fifteen or more for men). Although the first threshold seems reasonable, the second is questionable. I doubt that most people would regard a woman who drinks a glass of wine with dinner every day, and two on Saturdays, as an “excessive drinker.” By the same token, is a man who drinks two beers a day, and three on Fridays, really a “heavy drinker?” Perceptions obviously differ widely from person to person. More important, actual alcohol consumption depends on what kind of beer the drinker in question consumes. A “light” beer, for example, typically has less than half the alcohol content of imperial IPA of the same size.

A similar problem is encountered with the concept of “binge drinking.” “Five or more drinks on one occasion” might seem like a high figure, but it depends on how long an “occasion” lasts. The standard figure for research purposes is two hours. This duration is used because a typical man who consumes five standard drinks (or 0.6 fluid ounces of ethanol) in two hours will reach a blood-alcohol concentration over 0.08%, which counts as legally “drunk” in most U.S. states. But the surveys on which excessive-drinking data are based do not seem to be rigorous in this regard. According to AI, “respondents are not walked through a two-hour clock. So five beers over a six-hour dinner can be coded the same as five shots in an hour. That is a real measurement gap, not a quibble.”

For both “heavy drinking” and “binge drinking,” individual weight and muscle-mass should also be considered. All other things being equal, a heavier person must drink more alcohol than a lighter person to reach the same blood-alcohol concentration, which is the real measurement of intoxication. A muscular person, moreover, will have a lower blood-alcohol concentration than a less-muscular person of the same weight who drinks the same amount of alcohol over the same period of time.

Ideally, alcohol-consumption surveys would account for such factors, but that is not necessarily the case. Considerations of weight and muscle mass are ignored, and a twelve-ounce beer is usually treated as standard unit regardless of alcohol content. After much back-and-forth, my AI “informant” concluded by telling me that the definition of excessive drinking employed by the CDC’s Behavioral Risk Factor Surveillance System (BRFSS) “is operational and crude on purpose. It is useful for comparing places and tracking a risk category. It is a poor description of how drunk someone got on a given night or how much alcohol they actually swallowed.”

Finally, alcohol-consumption surveys face the same problems of sample representativeness that bedevil all pollsters. Many if not most persons refuse to respond to such surveys, and it cannot simply be assumed that non-responders have the same experiences as responders. Researchers are well aware of this problem and try to compensate, but it is not clear whether they do so adequately when it comes to “excessive drinking.” According to AI:

BRFSS tries to account for refusal and uneven participation—but only in a limited way. It does not fully correct for the possibility that drinkers and non-drinkers refuse at different rates. Most people who are called never complete an interview. Recent median state response rates are around 44% (roughly 31–65% by state). That is normal for large telephone surveys now, not a secret. It assumes that, within those groups, people who answer the phone drink like people who hang up. Such an assumption is questionable.

All of this is not to argue that maps of excessive drinking in the United States are worthless. I find them interesting and regard them as partially valid. But they are more suggestive than definitive. I would also prefer that they be give more modest titles, such as “Rates of Excessive Drinking as Indicated by Public-Health Surveys.” A brief note on how “excessive drinking” is defined would ideally be included on all such maps.

Deeper Problems with Maps of “Excessive Drinking” in the United States Read More »

Could U.S. Counties with Low Levels “Excessive Drinking” Really Have High Levels of Alcohol-Induced Mortality and Low Levels of Health?

The map of excessive drinking in the United States that was recently discussed in GeoCurrents was originally posted on IntoxiStates.com and is based on information from the CDC’s Behavioral Risk Factor Surveillance System, as packaged by the University of Wisconsin’s Population Health Institute County Health Rankings & Roadmaps (CHR&R). It clearly indicates that Wisconsin has the country’s highest rate of excessive drinking and overtly states that among the many counties of the U.S., Gallatin in Montana occupies the top place. The IntoxiStates map is not dated, but a 2025 map based on 2022 data from the same source paints a different picture. Published in the The Hill, this map puts Montana in the top position and depicts Iowa as also having a higher rate of excessive drinking than Wisconsin. The county-based map from the same article indicates that Missoula in Montana is the ‘drunkest” county, with a 29% excessive-drinking rate. The most recent data from CHR&R’s own website puts both Missoula and Madison counties in Montana ahead of Gallatin, but just barely (26% vs. 25%). The “excessive drinking” data used to make these maps, in other words, change from year to year. More to the point, excessive drinking in Wisconsin does not seem to be nearly as pervasive or unusual as it appears to be on the IntoxiStates map.

Excessive Drinking US map


Excessive Drinking US states map


The Hill Excessive Drinking Counties map


Montana Excessive Drinking by County map

The CHR&R’s  Montana map is particularly interesting, as it reveals a clear county-level correlation between relatively low rates of excessive drinking and high percentages of indigenous residents. This association is significant, as it contradicts a widely held stereotype. It might not, however, be valid. It would be expected that low levels of excessive drinking would be associated with low levels of alcohol-induced mortality, but that is not what the Montana data indicate. A map of alcohol-induced mortality in Montana in the Covid-year 2021, derived from a map published in a PLOS Global Public Health article, shows a surprising negative relationship between excessive drinking and death by drinking. Another pair of maps indicates that Montana counties with high rates of excessive drinking are significantly healthier than counties with low rates. (Correlation, of course, does not imply causation.)

Montana Excessive Drinking Indigenous Population maps


Montana Excessive Drinking and Alcohol-Induced Deaths map


Montana Excessive Drinking and Health map

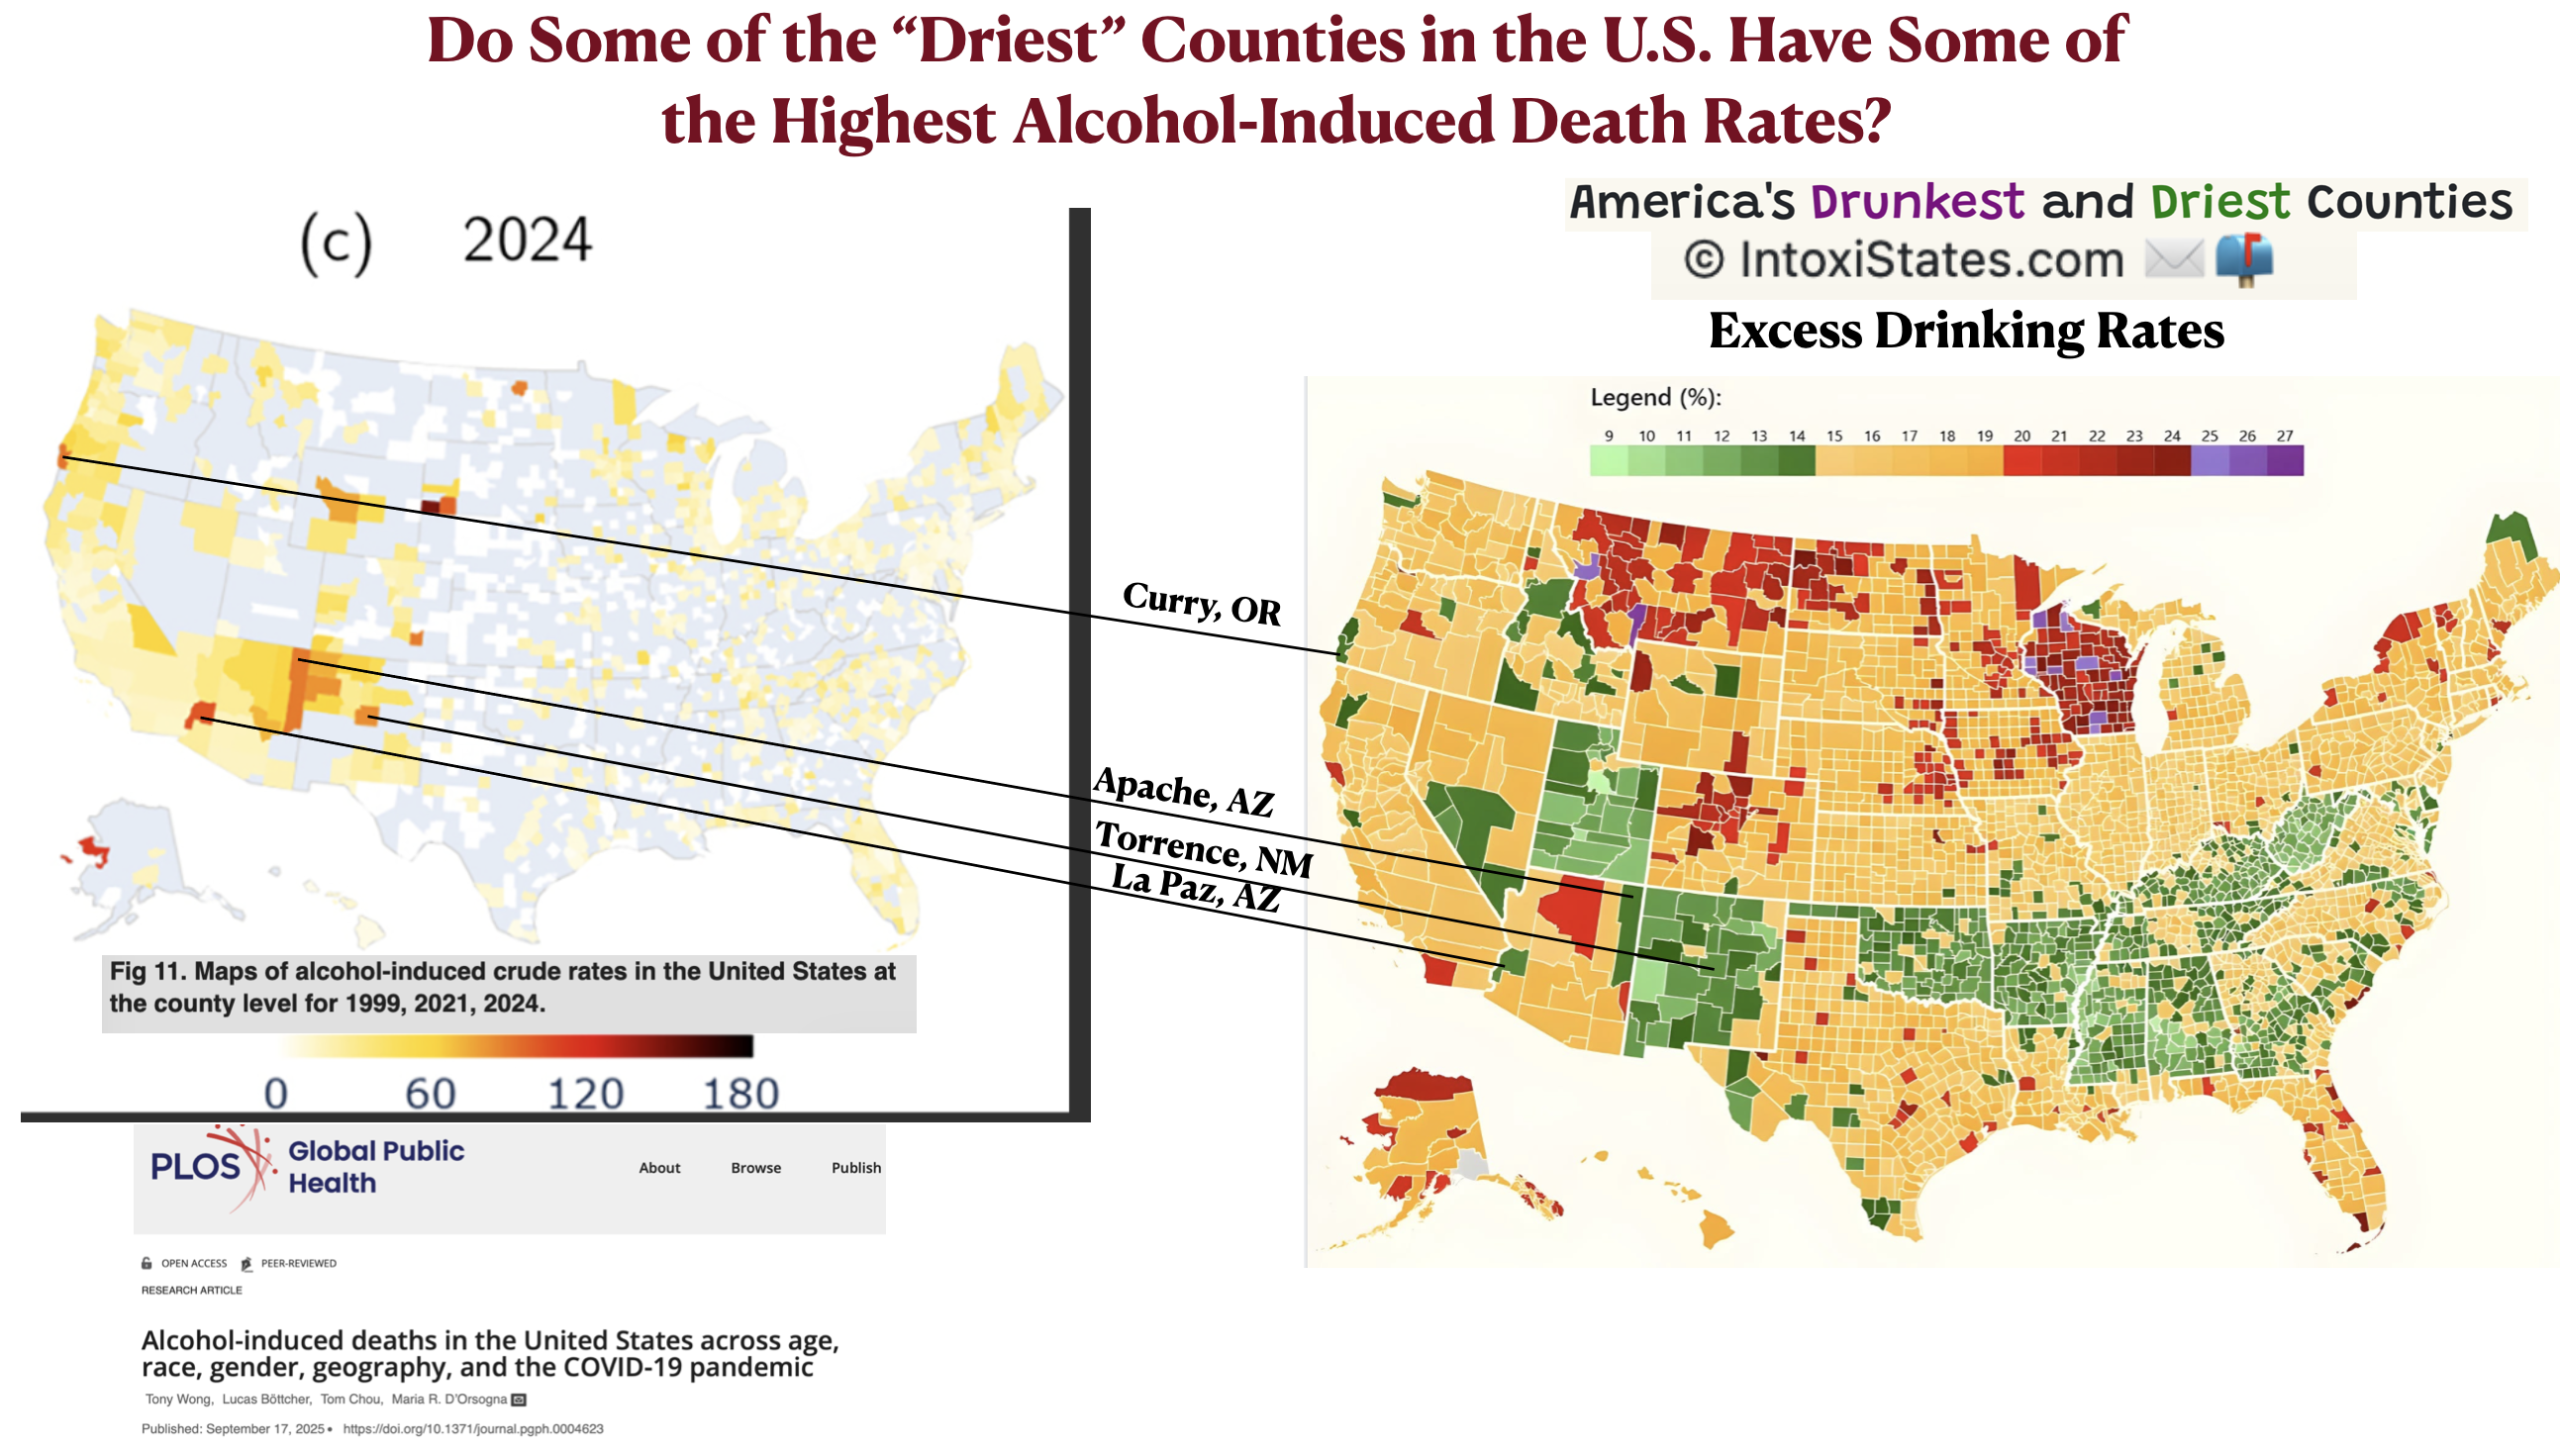
Montana does not seem to be alone in this regard. A pairing of the IntoxiStates map of excessive drinking with the PLOS Global Public Health map of alcohol-induced mortality in 2024 shows that several counties in other states have the same relationship. Curry County Oregon, Apache and La Paz counties in Arizona, and Torrence County New Mexico are all mapped as having low rates of excessive drinking and high rates of alcohol-induced death. Ethnic or racial differences do not seem to be a factor. Curry County is strongly white (83%), Apache County is strongly indigenous (75%), La Paz is highly mixed (61% white alone, 23% Hispanic/Latino, 14.5% American Indian) and Torrence is fairly evenly divided between whites and Hispanics (52% white alone, 42% Hispanic). As the final map in this post shows, many of the “driest” counties located in the interior U.S. south are also among the least healthy.

USA Excessive Drinking and Alcohol-Related Mortality map


USA Excessive Drinking and Health map

Such surprising findings indicate that the “excessive drinking” data need to be examined more closely, as will be done in the next GeoCurrents post.

Could U.S. Counties with Low Levels “Excessive Drinking” Really Have High Levels of Alcohol-Induced Mortality and Low Levels of Health? Read More »

Mapping Tobacco Use Now and in 1500

Tobacco use is plummeting over most of the world. This decline is easily seen on a map showing the change in the percentage of the adult population that uses tobacco from 2000 to 2020. If the World Health Organization data used to make this map are accurate, only five reporting countries saw an increase in tobacco users during this period: Croatia, Jordan, Oman, Republic of Congo, and Indonesia. Several countries, most notably China and France, reported small drops. But most saw major declines; in Bolivia, the percentage of adult tobacco users went from 37.1 to 12.7.

Screenshot

The regional patterns found on this map are intriguing. Tobacco use declined sharply over most of Africa, which already had relatively low rates of consumption. The increase in the Republic of Congo is therefore anomalous. Most of Latin America also saw a major decline in tobacco use. The patterns in Europe are more mixed, with sharp drops characterizing the north but with more modest declines elsewhere –  and a surprising increase in Croatia. Substantial drops are also evident in South Asia, particularly India. The same pattern is found in Southeast Asia, with the notable exception of Indonesia. In contrast, most of the Middle East and North Africa reported more modest declines, or, in the case of Jordan and Oman, small increases.

As the second map shows, many countries had high rates of tobacco use in 2000, with quite a few exceeding 50% of the adult population. Because tobacco consumption tends to be gender biased, in some countries substantial majorities of men were users at this time, Burma (Myanmar) most notably. South Asia also reported high rates of tobacco consumption a quarter century ago. Central and Eastern Europe was another area of widespread consumption, focused on the Balkans. Latin America reported more variable patterns, with low rates of use in Guatemala, Colombia, and Ecuador but with much higher rates in Chile and Cuba. In Africa the relatively high figure posted for Sierra Leone seems odd. Madagascar, a country of mixed African and Southeast Asian ancestry, intriguingly groups more with Southeast Asia than it does with Africa in regard to tobacco use.

Screenshot

As the third map shows, the regional patterns of tobacco use found in 2020 are roughly similar to those found on the map of 2000, albeit at lower levels almost across the board. Several countries stand out for their persistently high levels of consumption, including Indonesia, Papua New Guinea, Burma, and Greece.

Screenshot

In the year 1500, tobacco use was largely confined to the Western Hemisphere. In the Eastern Hemisphere, it was found only in Australia. Indigenous Australians over a large portion of the continent chewed the leaves of several plants in the Nicotiana genus, as well as those of a related nicotine-containing plant, Duboisia hopwoodii. These leaves, mixed with ash, are called pituri.

Screenshot

In the Western Hemisphere in 1500 tobacco use was ubiquitous, found almost everywhere except the high Arctic. Several species of the genus Nicotiana were widely cultivated and traded and served vital ritual, cultural, social, and even political functions. Some supposedly non-agricultural hunting and gathering societies grew tobacco, and others gathered wild tobacco leaves. The widely consumed species Nicotiana rustica was noted for its potency, with up to nine times more nicotine than N. tabacum as well as hallucinogenic harmala alkaloids. As a result, N. rustica was often used by shamans for religious experiences. Tobacco was also widely employed for medical purposes by indigenous peoples of North and South America. Such practices persist in some communities to this day. Despite its dangers, tobacco does have analgesic properties and several other demonstrable medical uses.

The geography of tobacco will be further explored in several forthcoming GeoCurrents posts.

Mapping Tobacco Use Now and in 1500 Read More »

Coffee World Vs Tea World: Mapping the Consumption of Hot, Caffeinated Drinks

Although both tea and coffee are consumed over most of the world, there is little overlap in the lists of the top tea and coffee consuming countries. This pattern is easily seen on the map posted below, which shows the world’s 16 top tea and coffee consuming countries on a per capita basis. Only the Netherlands makes both lists.

Screenshot

The top tea consuming countries are more geographically dispersed than the top coffee consuming countries. High levels of coffee consumption are found primarily in Europe, particularly in the Nordic countries. Outside of Europe, only Brazil and Canada make the list, and only Canada ranks in the top 10 (coming in at 10th place). The United States occupies the 25th slot, a sharp drop from its position a century ago. In 1900, the U.S. took in roughly half the world’s coffee exports. Its coffee consumption peaked around 1945 and subsequently began a slow but steady decline until about 1995. This drop is usually attributed to the marked increase in soft-drink consumption.

High levels of tea consumption, unlike those of coffee, are geographically dispersed. Countries in the top-sixteen list are in Europe, the Middle East, South Asia, East Asia, Africa, Latin America, and Oceania. China – where tea drinking originated – ranks in the 21st position. Intriguingly several countries that were once noted for their coffee culture largely switched to tea, Turkey most prominently. After World War I, the new Turkish Republic encouraged tea growing and drinking, partly to reduce imports. Coffee, unlike tea, cannot be grown in the country.

At the dawn of the early modern era five hundred years ago, tea and coffee were regional drinks. Both beverages subsequently underwent globalization, a process that accelerated in the mid-17th century. The two maps posted below show the approximate areas of tea and coffee origination, as well as the main areas of consumption around the year 1500. As it is difficult to find reliable information for many areas, these maps should be regarded as provisional approximations.

Screenshot

Screenshot

The main cultivation zones of both tea and coffee have also experienced profound shifts over the centuries. The final map shows some of the major geographical changes in coffee production. Initially, wild beans were gathered in the southern highlands of Ethiopia. By 1500, coffee growing was well established in the highlands of Yemen across the Red Sea. Problems with supply prompted European imperial powers to establish coffee plantations in their own domains by the early 1700s. Slave-grown coffee from the Caribbean, particularly Haiti, came to dominate the export market. After the successful Haitian rebellion (1791-1804), the main area of coffee production shifted to Asia, particularly to the British-controlled island of Sri Lanka and the Dutch-controlled island of Java. The fungal disease called coffee leaf rust, however, devastated Asian coffee plantations after 1860. Most were abandoned, with plantation owners in in Sri Lanka quickly switching to tea. The main coffee-production zone then shifted to Latin America, which long remained free of rust. By 1900, roughly 75% of the world’s coffee crop was grown in Brazil. But although Brazil remained the global leader, by the 1920s superior coffee was being produced in Colombia and Central America. Meanwhile, extensive coffee cultivation returned to Asia with the introduction of hardier but lower-quality robusta coffee (Coffea canephora). After reunification, Vietnam emphasized coffee cultivation, and by 1999 surpassed Colombia to become the world’s second largest producer. Meanwhile, many other countries became significant growers and exporters. Ethiopia, coffee’s homeland, now ranks in the sixth position, following Brazil, Vietnam, Colombia, Indonesia, and Honduras.

Screenshot

Coffee World Vs Tea World: Mapping the Consumption of Hot, Caffeinated Drinks Read More »

Mapping Yerba Mate Consumption and That of Its Cousin, Ilex vomitoria (Yaupon)

Almost all data sources rank Turkey (Türkiye) as the world’s top tea-drinking country, and by a considerable margin. According to Wikipedia’s article on the subject, annual per capita tea consumption in Turley is 3.16 kg (6.96 lb), far overshadowing second-place Ireland’s 2.19 kg (4.83 lb). Yet according to a World Population Review article that lists 2024 tea consumption by country, the people of southern South America drink much more tea than those Turkey. Here the per capita tea consumption of Argentina is mapped as seven times greater than that of Turkey. What gives?

Screenshot

The answer to this seeming mystery is that the writers at World Population Review have confused yerba mate with tea. Although producing a caffeine-rich beverage superficially similar to tea, yerba mate (a species of holly; Ilex paraguariensis), has no relationship with tea (a species of camelia; Camellia sinensis). Evidently, mate is consumed in much greater quantities in mate-drinking cultures than tea in consumed in tea-drinking cultures.

Although yerba mate is now globalizing, consumption is still focused in four South American countries: Argentina, Uruguay, Paraguay, and Brazil. Maps of mate-drinking that highlight these countries are somewhat misleading, however, as most of Brazil falls outside the mate zone, as seen in the second map below. Consumption in Brazil is heavily concentrated in the far south, particular in the state of Rio Grande do Sol. This pattern is not surprising, as Rio Grande do Sol was long contested by the Portuguese and Spanish colonial empires, and later by Brazil and its Spanish-speaking neighbors to the south. As a result, its culture has some affinities with those of Argentina, Uruguay, and Paraguay. In Brazil, the people of the state are often called gaúchos, which would be equivalent to calling Texans “cowboys.” Actual gaúchos tend to drink a lot of yerba mate, just as American cowboys have historically consumed a lot of coffee.

Screenshot

Screenshot

The people Rio Grande do Sol generally embrace their gaúcho designation. As Ruben George Oliven explains in a 2006 Nations and Nationalism article:

From the 1930s, Brazil experienced a growing national centralisation and the construction of Brasilidade (Brazilianness). The military regime (1964–85) deepened centralisation and emphasised national identity, little space being left for regional identities. With the political opening and the redemocratisation of Brazil, starting at the end of the 1970s, the stress was on differences in a period in which Brazil had already achieved a high degree of integration. Identities were re-created, among them that of Rio Grande do Sul, the southernmost state of Brazil, where a strong revival of gaúcho culture took place. The 1980s and 1990s were marked by a growing development of activities and disputes linked to the gaúcho tradition. In spite of the fact that Rio Grande do Sul is predominantly urban and industrialised, this process reached out to the state’s rural past and the equestrian figure of the gaúcho.

Intriguingly, the world’s three main hot, caffeinated drinks – coffee, tea, and mate – all have religious roots. Coffee was popularized in Yemen by Sufi mystics who found it useful for keeping awake during all-night chanting sessions. Tea was first popularized in China by Buddhist monks who found it useful for keeping awake during all-night meditation sessions. The story of mate is different, but it too has religious aspects. In pre-colonial times, mate consumption was evidently limited to two relatively small subgroups of the Guaraní people. The Jesuits subsequently united the Guaraní people of Paraguay under a theocratic state. They encouraged mate consumption and effectively domesticated the plant. Mate eventually became the national beverage of Paraguay, and later expanded into Argentina, Uruguay, and southern Brazil.

Yeba mate is closely related to another caffeine plant, Yaupon, which grows in the southeastern lowlands of the United States. Indigenous peoples drank Yaupon tea, sometimes to excess. The plant’s scientific name, Ilex vomitoria, “comes from an observation by early Europeans that the ingestion of the plant was followed by vomiting in certain ceremonies[;]… the vomiting may have resulted from the great quantities in which they drank the beverage, coupled with fasting.”  Such a fasting and (caffeine-) feasting regime also probably had spiritual roots.

Screenshot

Yaupon is now undergoing something of a comeback in the U.S., grown by people who want a “healthy coffee alternative” and who value its beauty and the food that it provides for wildlife. As Lily Anderson Messec writes:

Pollinators flock to its masses of tiny white flowers in spring, and birds eat the berries that follow the flowers. Most importantly, our native insects feed on these plants they have evolved with, providing protein rich meals (in the form of themselves) for birds and other wildlife.

The wildlife, however, are not the only ones eating it. The prime reason I planted my Yaupon was for its caffeine rich leaves. By weight, the leaves contain more caffeine than both coffee beans and green tea —the highest caffeine content of any plant native to North America. Yaupon holly is also high in antioxidants and less bitter than green tea. It is a close cousin of the South American yerba maté (Ilex paraguariensis) and its tea is similar in flavor and quality.

Mapping Yerba Mate Consumption and That of Its Cousin, Ilex vomitoria (Yaupon) Read More »

Alcohol & Religiosity in the United States, and the West Virginia Exception

Maps of alcohol consumption in the United States reveal several regions with very low drinking rates. The most prominent is the LDS (Mormon) cultural region focused on Utah and eastern Idaho. The so-called Bible Belt of the southeastern and south-central states is also clearly visible, although most of its coastal counties are excluded. More surprising are several heavily Native American counties in the northern Great Plains and Southwest. Many tribal governments restrict alcohol sales, but actual consumption rates may be higher than the map indicates. Comparing the maps posted here, several indigenous-dominated counties in South Dakota are shown as having low rates of alcohol drinking but relatively high rates of heaving drinking.

Screenshot

Screenshot

In general, high rates of adherence to religious demoninations that oppose alcohol consumption are associated with low rates of drinking. Lyman Stone, in a fantastic, map-rich post called “Mapping American Churches,” makes this point by juxtaposing a map of “anti-alcohol religious attendance rate” with one showing the prevalence of heavy drinking. As he bluntly notes, “Turns out religious opposition to drinking reduces drinking. Surprise.”

Screenshot

But although this correlation is striking if unsurprising, interesting – and surprising – exceptions can be found. The most prominent is the central Appalachian region, focused on West Virginia. West Virginia reports very low rates of alcohol consumption and abuse – lower than those of any other state except Utah according to some sources. Yet West Virginia has only a middling level of membership in anti-alcohol churches. It also has a very low rate of overall religious adherence (according to data from 2000).

Screenshot

Screenshot

Screenshot

Several explanations have been offered for West Virginia’s official rate of alcohol consumption. One is the state’s high level of opioid abuse, as revealed by a 2015 map of overdose deaths.  Another is the prevalence of illicit and untaxed alcohol (“moonshine”) that escapes tabulation.

Screenshot

A 2019 article in the Exponent Telegram (Clarksburg, WV) expressed some doubt about the state’s reported level of alcohol use. While acknowledging that West Virginia “ranks the lowest in the nation for adult prevalence of both heavy drinking and binge drinking …[and] has been either the lowest or second lowest for many years,” the article went on to note that:

In the period from 2003 to 2012, the most recent data available, 1,092 people died in West Virginia due to crashes involving a driver with a blood alcohol content of 0.08 or higher. That rate, 12.9 per 100,000 population, is well above the national average rate of 6.7 for the same time period.

Although I doubt that West Virginia has one of the lowest alcohol-consumption rates in the United States, it would seem to be lower than one might expect given the state’s history, economic conditions, and relatively low rates of membership in anti-alcohol churches.

Alcohol & Religiosity in the United States, and the West Virginia Exception Read More »

Mapping the Historical Distribution of Alcohol Consumption Circa 1500

I am currently teaching a class for Stanford University’s Continuing Studies Program on the history and geography of natural psychoactive substances. Over the next nine weeks, I will be posting GeoCurrents articles derived from these lectures.

I have mapped the global distribution of each substance under consideration at the beginning of the early modern era (circa 1500). Creating these maps was tricky, and I cannot vouch for their accuracy. In many cases, the only information I was able to find was through ChatGPT. The responses that I received from the chatbot the were often too vague to be of much use. For example, when I asked, “Did the indigenous peoples of the Bismarck Archipelago have alcohol?” ChatGPT told me that “The indigenous peoples of the Bismarck Archipelago, located in the western Pacific Ocean, did not have traditional alcoholic beverages in the same way as some other cultures did. Alcohol consumption in these communities was not widespread before the arrival of European colonial powers.” I also know from experience that ChatGPT sometimes provides nonsensical answers, and a few of its responses to my alcohol-distribution questions are contradicted by other sources. As a result, these maps must be taken with a grain of salt. Note that I have put question marks in areas where the information that I found is conflicting.

Screenshot

The first map in this series, posted above, shows the distribution of alcohol (ethanol) consumption circa 1500 CE. Alcohol was at the time the world’s most widely distributed psychoactive substance used for “recreational” purposes. It was known almost everywhere in Africa and Eurasia. Much of the Eurasian Arctic, however, was an exception owing largely to its lack of fermentable substances. Alcohol was not traditionally consumed over most of the Pacific. Some coastal populations in New Guinea made alcoholic beverages from abundant and easily fermented palm sap, but ethanol was apparently not known in the more densely populated central highlands. In Polynesia and most of Micronesia and Melanesia, alcohol was unknown, but kava (Piper methysticum) served a similar function in many areas.

Alcohol was widely used almost everywhere in South America and Mesoamerica. This “drinking zone” extended into some parts of what is now the southwestern United States, particularly among the so-called Pueblo Indians. Over the rest of North America, however, ethanol consumption was either unknown or very rare. There are reports that indigenous groups in what is now the southeastern United States sometimes made alcohol and some sources claim that Iroquoian peoples in the northeast fermented maple syrup. Overall, however, it is something of a mystery why alcohol was either unknown or little-used over most of North America.

Although alcohol was the most widely used psychoactive substance at the beginning of the early modern era, it was also subjected to the most widespread prohibitions, as the second map shows. In the Islamic world, alcohol was religiously prohibited, although some lax interpretations of the Quran held that only the consumption of wine was banned. And even though wine was forbidden in all interpretations of Islamic law, it was still widely consumed, especially in the Persian-speaking region. In the Hindu communities of India, traditional prohibitions of alcohol were largely based on caste membership. In general, high-caste Brahmins (“priests”) and Vaishyas (“merchants”) were not permitted to drink, although high-caste Kshatriyas (“warriors” and “rulers”) were. Low-ranking Dalits (“untouchables”) could drink. Customs varied among the middling Shudra groups, although the general rule was that a rejection of alcohol enhanced a group’s purity. Alcohol consumption was strongly discouraged by Theravada Buddhism, the dominant sect of Buddhism in Sri Lanka, Burma, Thailand, Laos, and Cambodia. Ethanol was certainly consumed in these lands in the early modern period, but a degree of stigma surrounded its use.

Screenshot

It is intriguing that the zone of widespread alcohol prohibition is essentially located in the center of the region of historical alcohol consumption. Although Egypt and Iraq today have very low drinking rates, in ancient times alcohol had important religious implications in both lands. In Sumer (southern Iraq), usually regarded as the world’s first civilization, beer was viewed as an essential attribute of civilization. In Gilgamesh, the world’s first epic, the wild man Enkidu was domesticated by, among other things, the consumption of beer.

Screenshot

Screenshot

Sumerian beer was so thick and porridge-like that it had to be consumed through special straws that could filter out the solids, as is seen on many images from the era. Today, curious brewers are reproducing Sumerian beer and drinking it in the same manner.

Screenshot

Mapping the Historical Distribution of Alcohol Consumption Circa 1500 Read More »