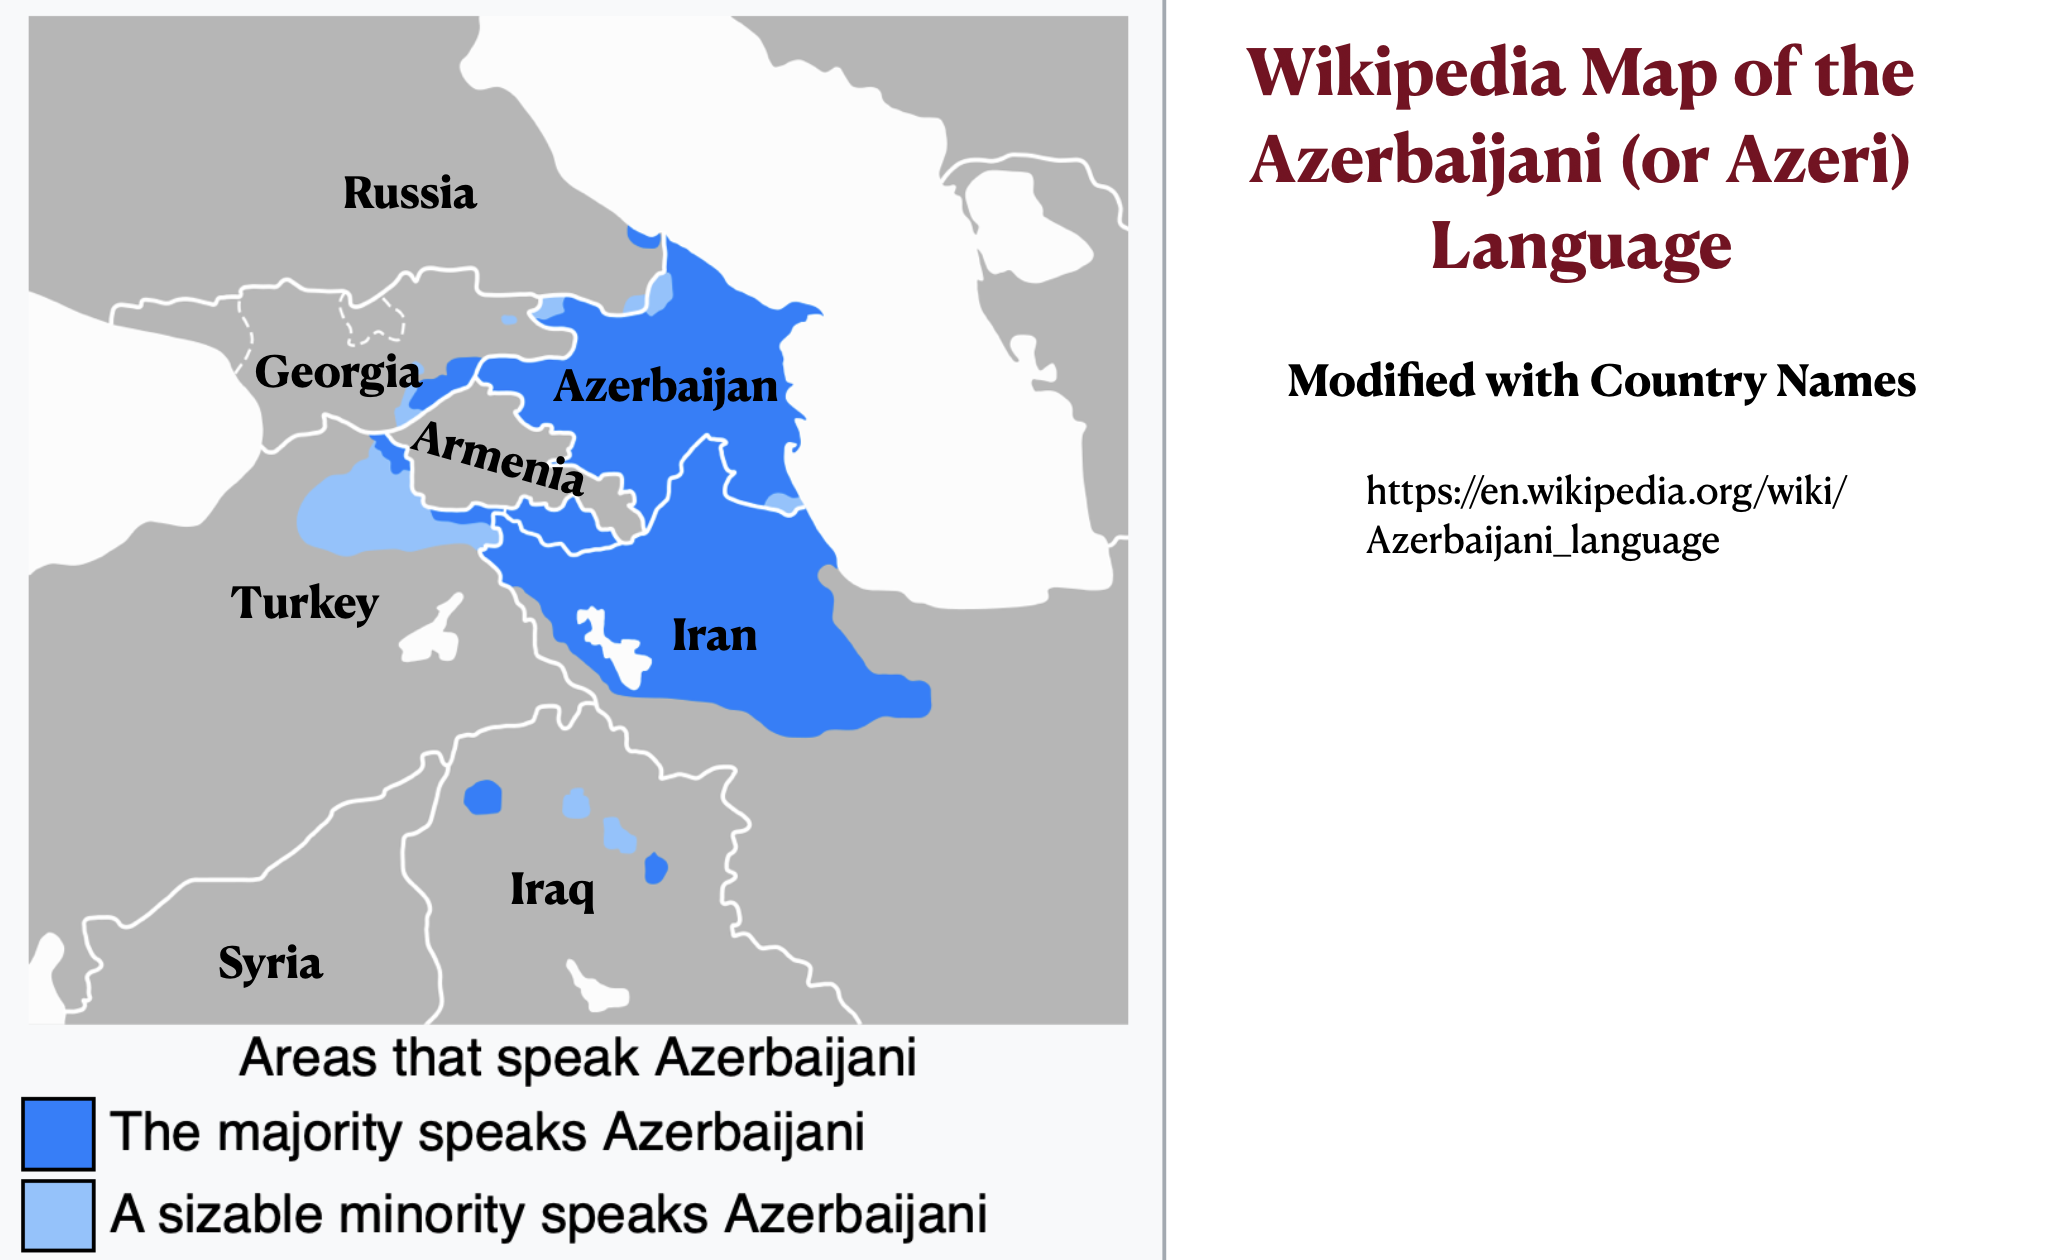
The previous post argued that the “Persian” (or Farsi-speaking) provinces of Iran are not necessarily more prosperous and economically developed than the “non-Persian” provinces, focusing on the relatively affluent but non-Farsi-speaking Caspian region, particularly Mazandaran province. The Azeri-speaking (or Azerbaijani-speaking) northwestern region of Iran also economically ranks somewhat higher than average. It is, however, less economically developed than the neighboring Azeri-speaking country of Azerbaijan.
Iranian Azerbaijan Income Map
Iranian Azerbaijan Per Capita GDP Maps
Rather than framing the issue of Iran’s uneven economic development around the distinction between Farsi- and non-Farsi speakers, it is better to organize it around the distinction between “core Iranian ethnic groups” and “non-core ethnic groups.” The Mazandaranis, for example, are not Farsi-speakers, but they are so integral to the Iranian nation that they have often been classified as “Persian.” The Wikipedia article on the Iranian province of Golestan, for example, claims that “The Mazandaranis who inhabit the foothills … were subsumed under the rubric ‘Persian’ by these official statistics.”
Although the Azeris, who speak a Turkic language, are never classified as Persians, they have been central players in the Iranian state and nation for centuries. According to many sources, Azeris are, if anything, over-represented in the country’s elite population. In the core provinces of Tehran and Alborz, Azeris constitute up to a quarter of the population. The actual percentage of Azeri-speakers in these provinces, however, is difficult if not impossible to determine due the prevalence of intermarriage and bilingualism. To be sure, cultural conflicts occasionally arise, such as the 2006 “cartoon cockroach controversy” analyzed in a previous GeoCurrents post. Overall, however, they are of little significance.
Azerbaijani language map
Although Azeri is in the Turkic language family, most of the inhabitants of “greater Azerbaijan” (northwestern Iran and independent Azerbaijan) seem to have spoken the Iranian language of Old Azeri (or Azari) up to the early-modern period. The region had been fully part of the Persian cultural sphere, and it largely remained so after the switch to a Turkic tongue.
The “Old Azari” language–previously one of the major Iranian languages–comprised a sprachbund of dialects distributed in a broad range between lake Urmia in the west and the Caspian littoral in the east. Old Azari seems to have shared a genetic affinity with the ancestor of the modern Talysh language, and it further appears to form a broader group with the so-called “Northwestern” branch of Iranian including modern Gilaki, Māzanderāni, Semnāni, and Zaza-Gorani. Some linguists hold that the southern Tāti varieties of Iranian Azerbaijan … are peripheral remnants of Old Azari. As such, this language has been spoken in the region of Azerbaijan for at least three millennia.
…
It appears Old Azari only lost its status as the majority language between the 16th-17th centuries with the ascent of the Qizilbash-backed Safavids. The subsequent influx of numerous Turkic military elements into the region further spread Turkic at the detriment of Old Azari, which in turn receded and ceased to be used, at least in the major urban centers. Notwithstanding the city of Tabriz maintained a number of distinctly Old Azari-speaking neighborhoods well into the Safavid period with the poet Ruhi Anārjānī composing a compendium of the language as late as the 17th century. However by the turn of the 20th century the Turkification of Azerbaijan was near completion, with the old Iranic speakers found exclusively in remote recesses of the mountains or other isolated areas such as Harzand village in Marand. Lamentably, language shift is currently in progress and the remaining Tāti dialects face a state of attrition and imminent endangerment.
Afsheen Sharifzadeh also notes that the Azerbaijani dialects of northwestern Iran and independent Azerbaijan are currently diverging:
The Northern and Southern varieties of Azerbaijani are moderately mutually intelligible without training. Since, for several decades, there has been little, if any, cultural exchange between the two parts of Azerbaijan, the mutual intelligibility is decreasing. Today the two languages are remarkably distinct in phonology, morphology, syntax, and source of loanwords; purist efforts upon the Northern variety have uprooted numerous Persianisms in favor of Russianisms and revisionist Turkic models, while the Southern variety continues to rely upon Persian much as it has since its arrival to the region.
The previous GeoCurrents post showed that the location of oil and natural gas deposits provides a partial explanation of the differences in the distribution of wealth and economic productivity across the country. But other factors must also be considered. Could language and ethnicity play a role? It has often been argued that the Persian, or Farsi-speaking, central area of Iran is more developed than the non-Persian peripheries. In 2017, for example, the Kurdish Human Rights Association asserted that “Persian province are the richest and non-Persian provinces are the poorest,” arguing that discrimination against Kurds and other minority groups explains this pattern.
But is it actually true that “the Persian province” are the richest parts of Iran? Although this assertion does have some validity, it is also misleading, as we will see in the next few GeoCurrents posts.
A little background on the ethnic situation is first needed. Iran is a multi-lingual country with a well-established sense of common national identity across most of its ethnic groups. Farsi, or Persian, is the national language and is spoken by almost everyone in the country. But it is the mother tongue of only around 50 to 62 percent of Iran’s population. According to some estimates, as many as twenty-five percent speak Azeri, or Azerbaijani, as their first language (see the pie chart below), although most sources put the figure at around 15 percent. The modified Wikipedia map posted below shows the distribution of the most important languages of Iran. As can be seen, Farsi/Persian dominates the central region, with minority languages located in most peripheral areas.
Iran Languages Map
Iran Language Pie Chart
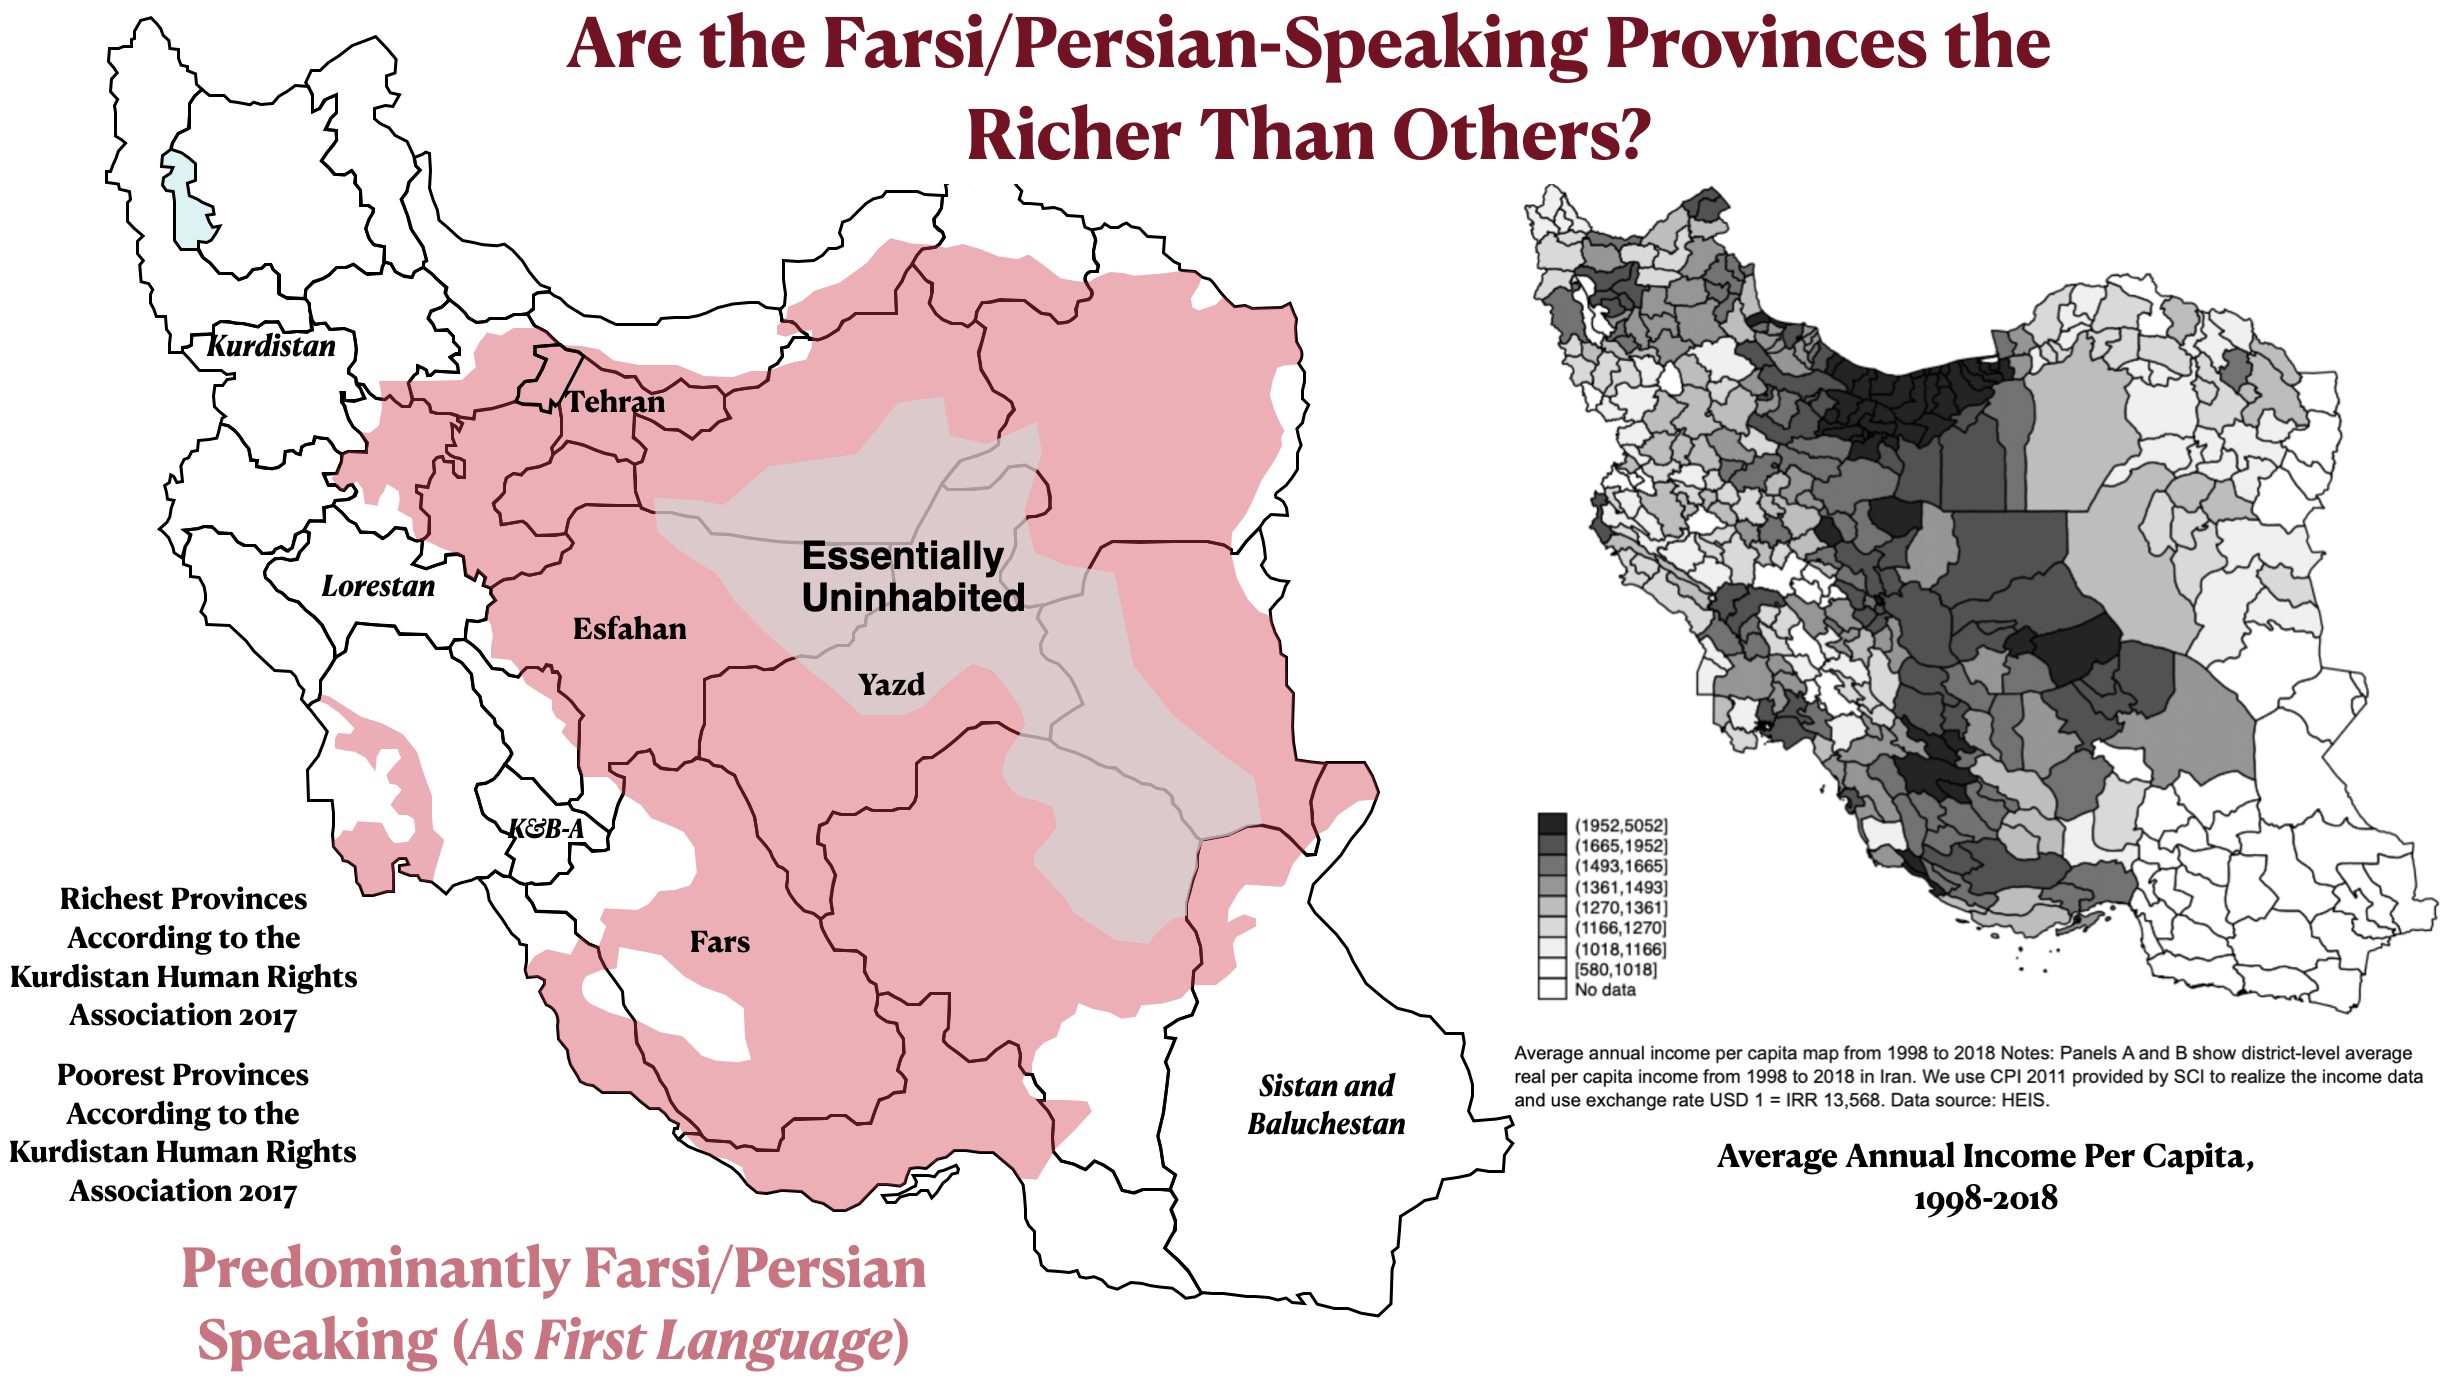
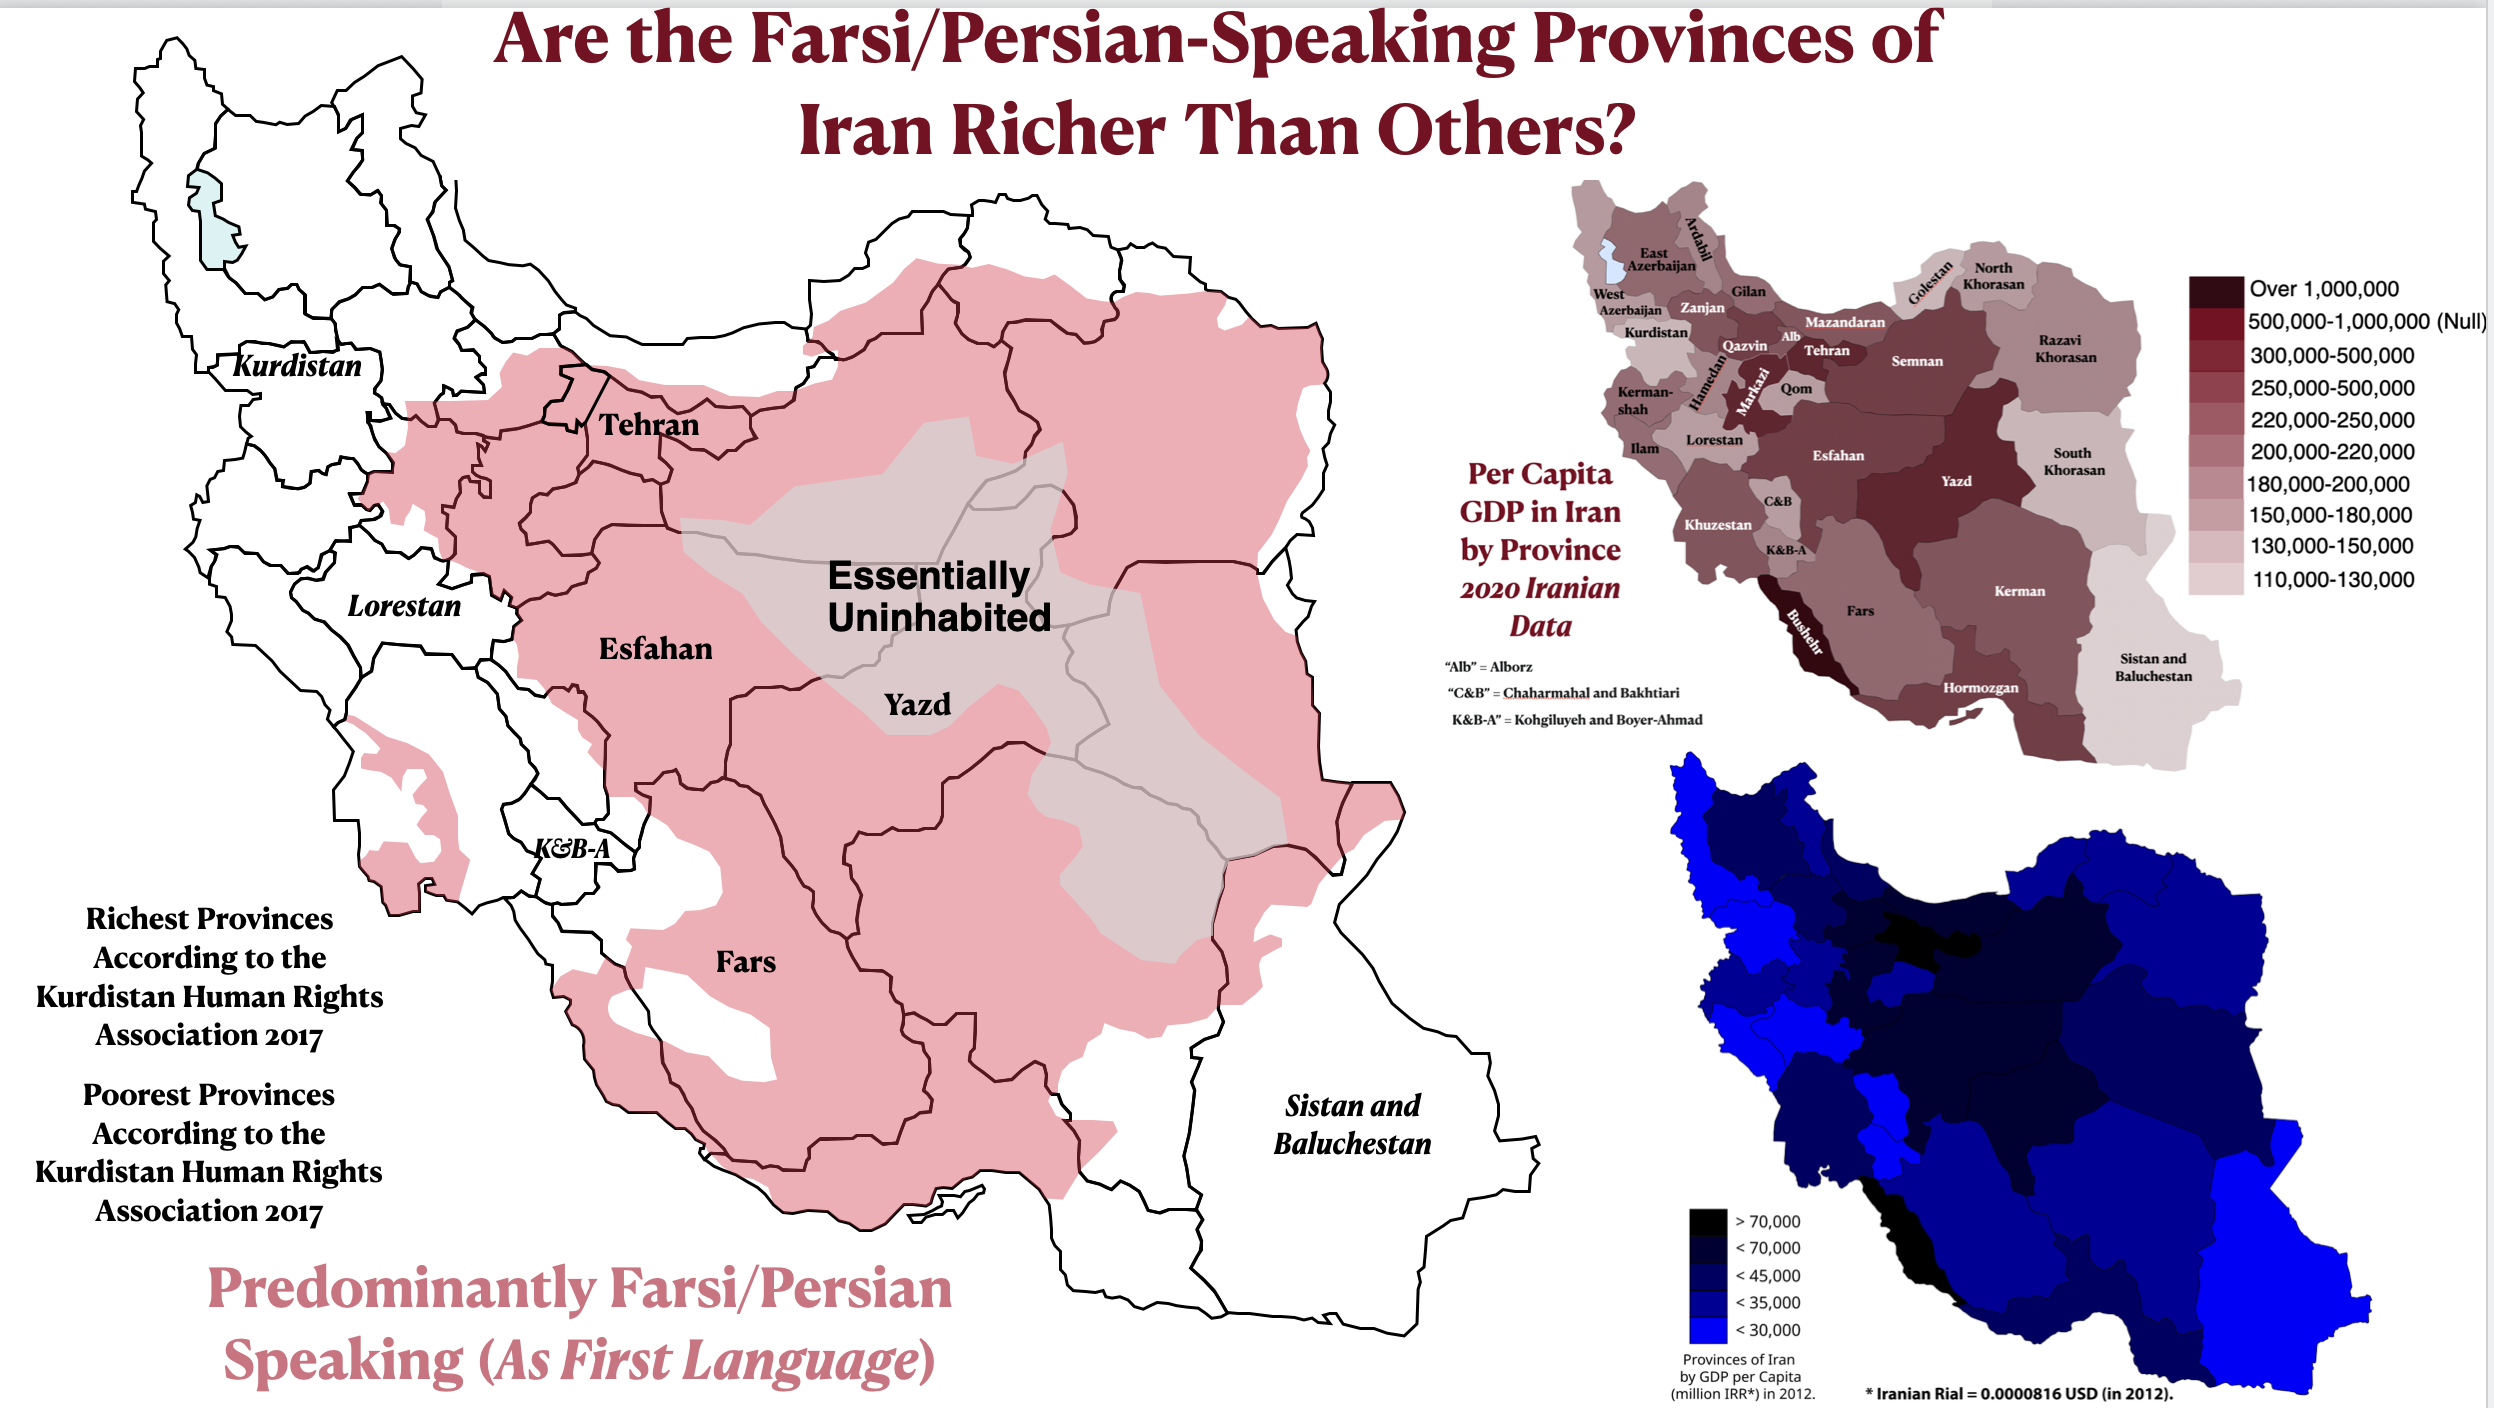
For the next set of maps, I have isolated the Farsi/Persian-speaking region from the language map posted above so that it can be compared with the economic maps of Iran analyzed in the preceding GeoCurrents posts. The second figure below compares the map of Farsi speakers with two maps of per capita GDP, and the first compares it with a map of per capita average income. As these comparisons show, there is a correlation between Persian ethnicity and higher-than-average economic productivity and income, but it not particularly strong. Several non-Persian areas, for example, have elevated economic figures.
Iran Farsi-Speaking Areas and Average Income Map
Iran Farsi-Speaking Area and Per Capita GDP map
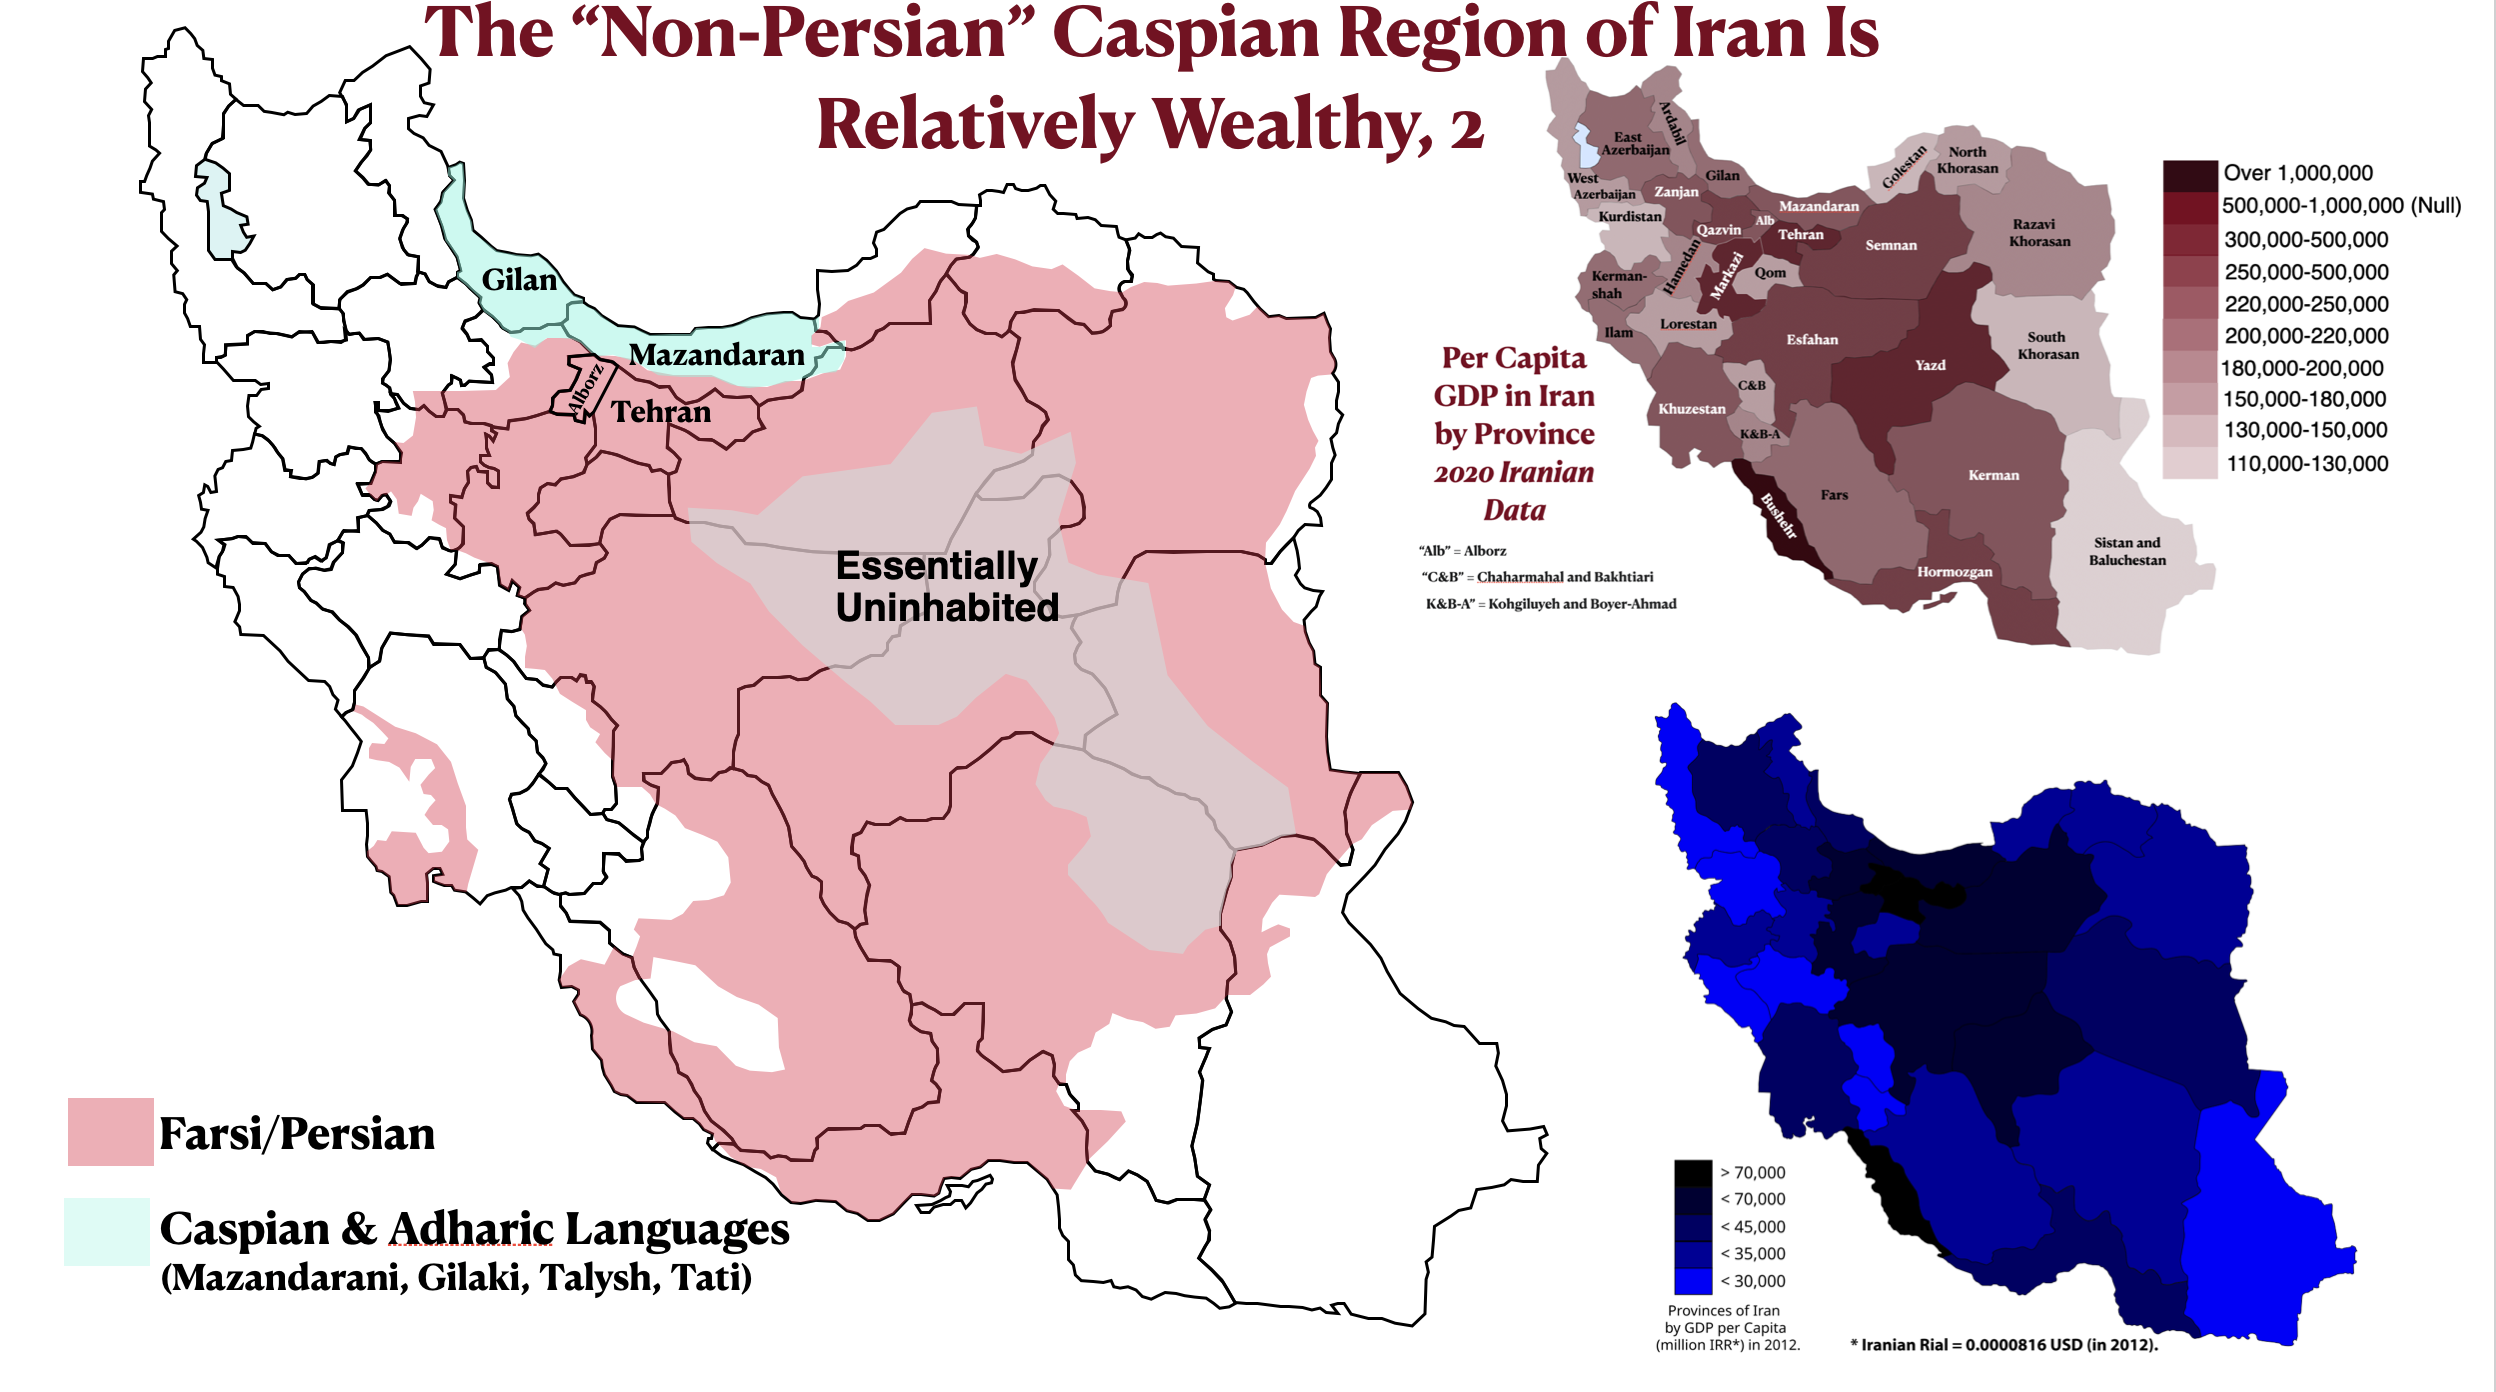
The rest of today’s post examines the relatively prosperous but non-Farsi-speaking Caspian region of north-central Iran. As the per capita income map shows, the largest contiguous block of counties in the highest per-capita-income category is found in north-central Iran. This relatively prosperous region is anchored by Tehran and Alborz provinces, Iran’s political and economic core. But it also extends across the formidable Alborz (Elburz) mountains to encompass Mazandaran province on the south shore of the Caspian Sea. Some high-income counties are also found in Gilan Province, located to the northwest of Mazandaran. Mazandaran is also shown on most maps as having higher-than-average per capita GDP.
Iran Caspian Region Mazandaran Average Income Maps
Iran Caspian Region Per Capita GDP Maps
Physical Map of Iran with Tehran, Alborz, and Mazandaran Provinces Highlighted
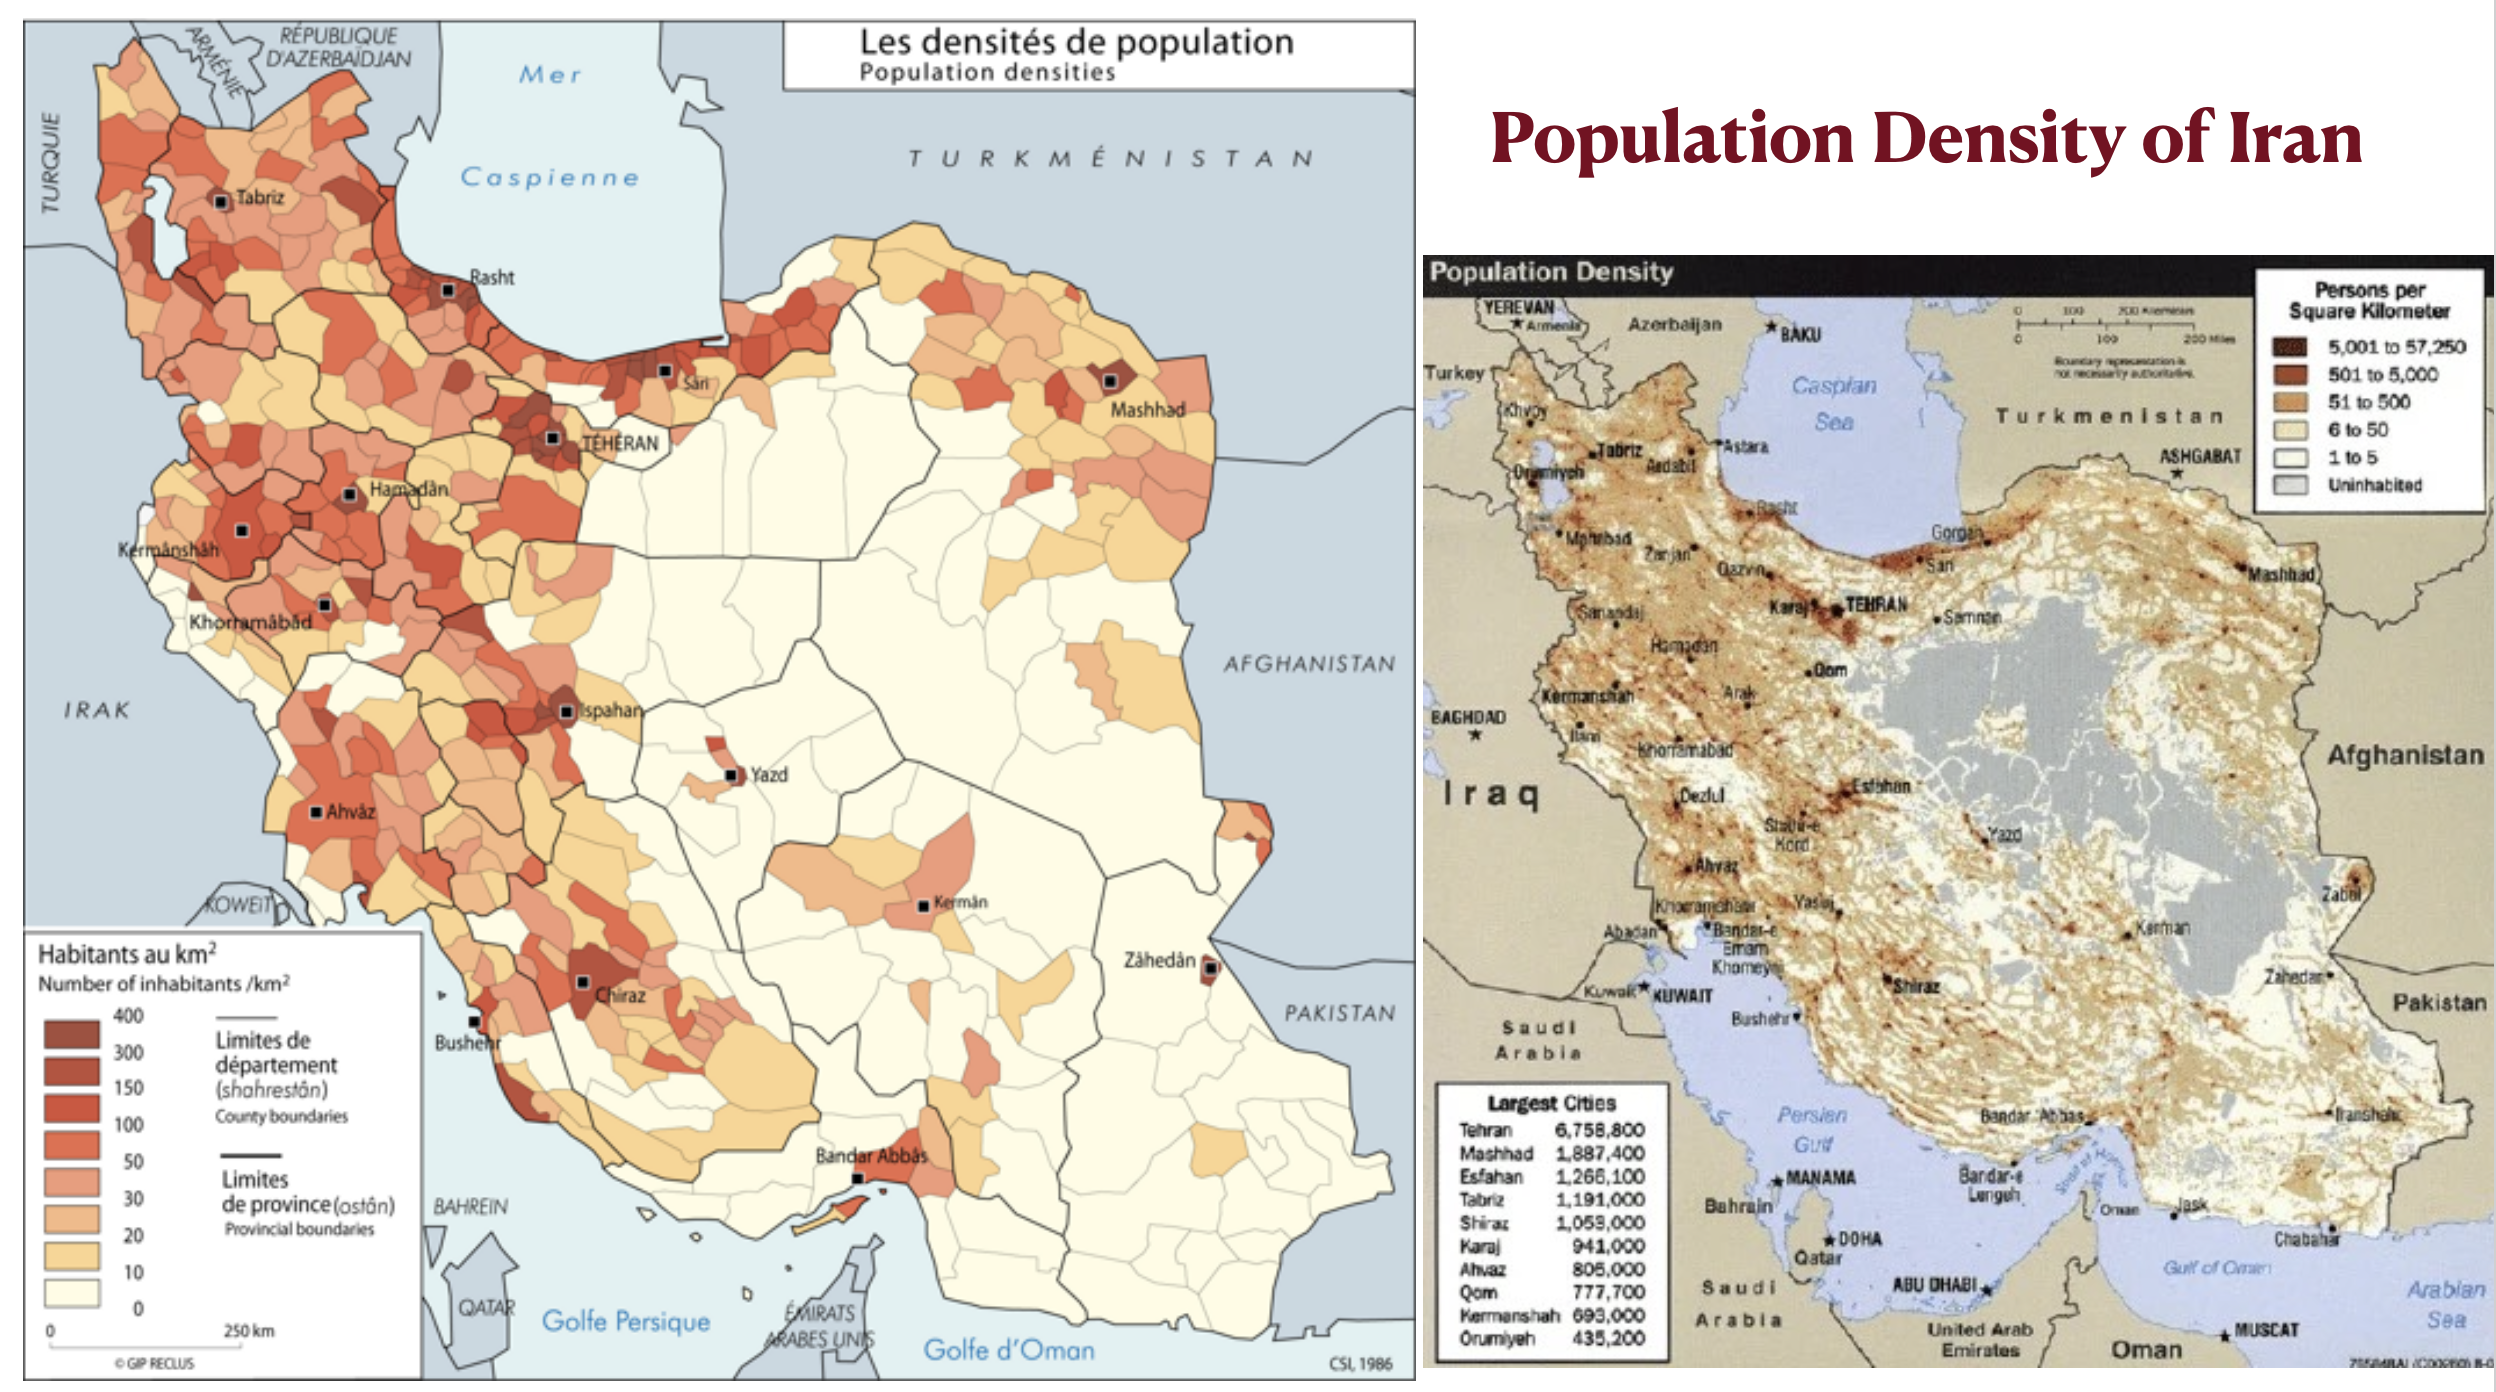
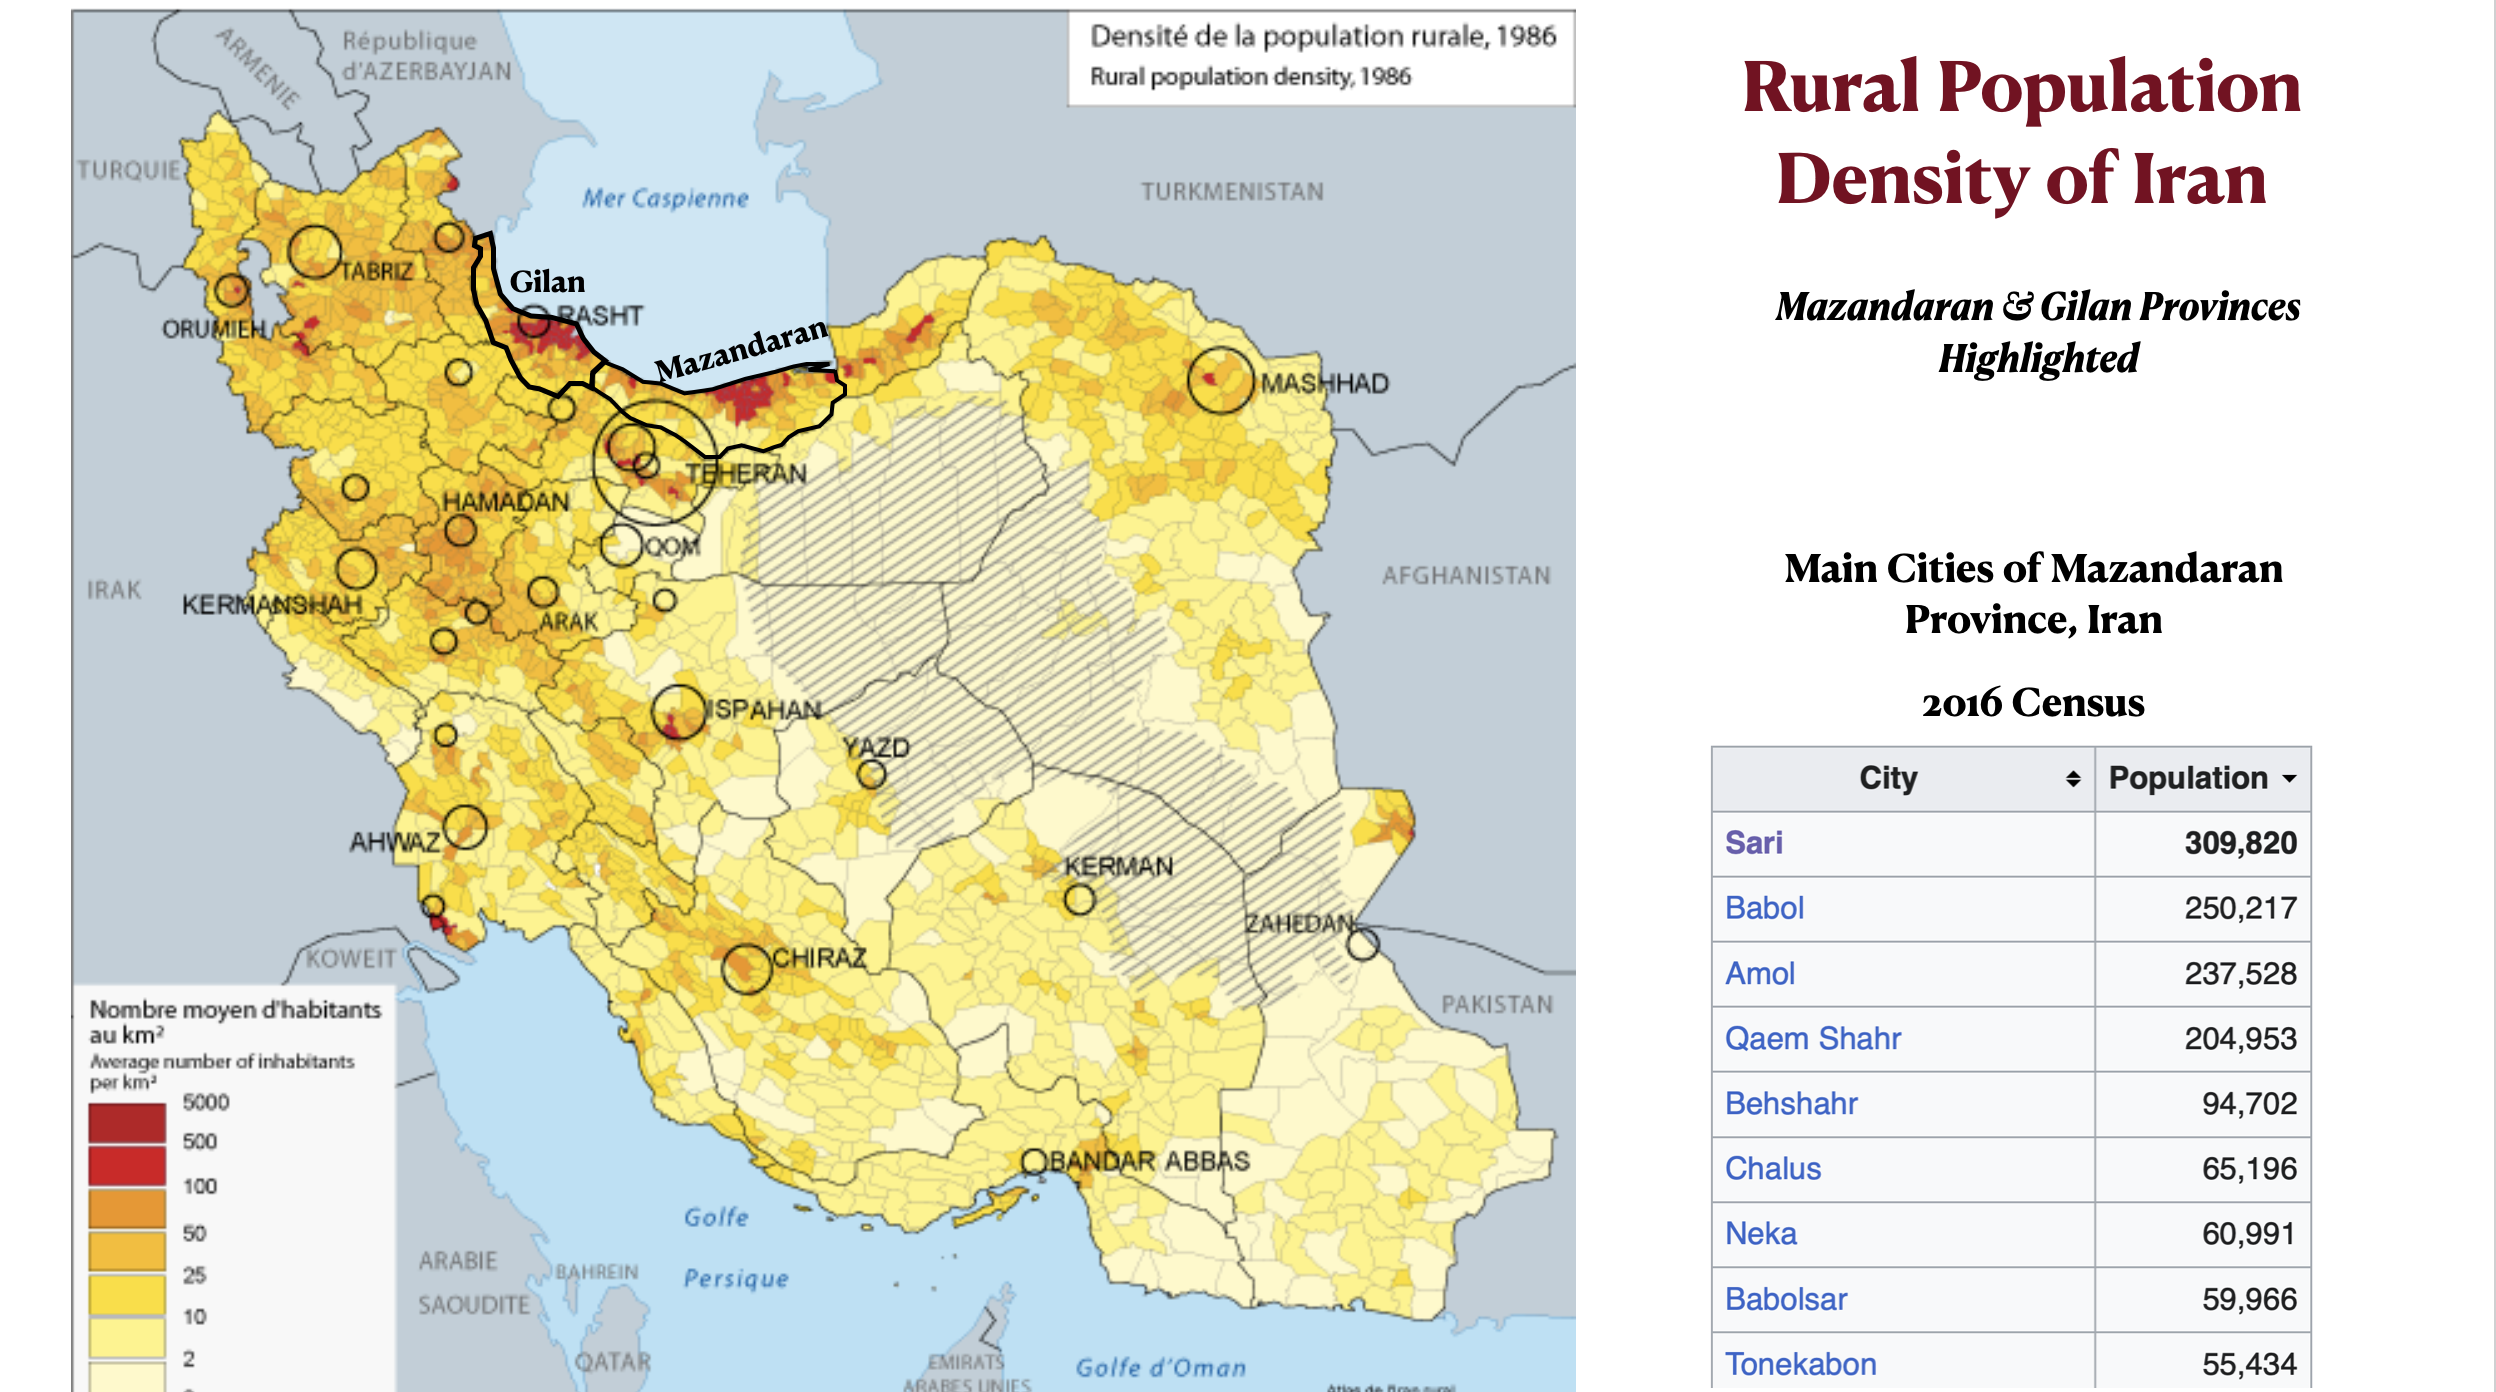
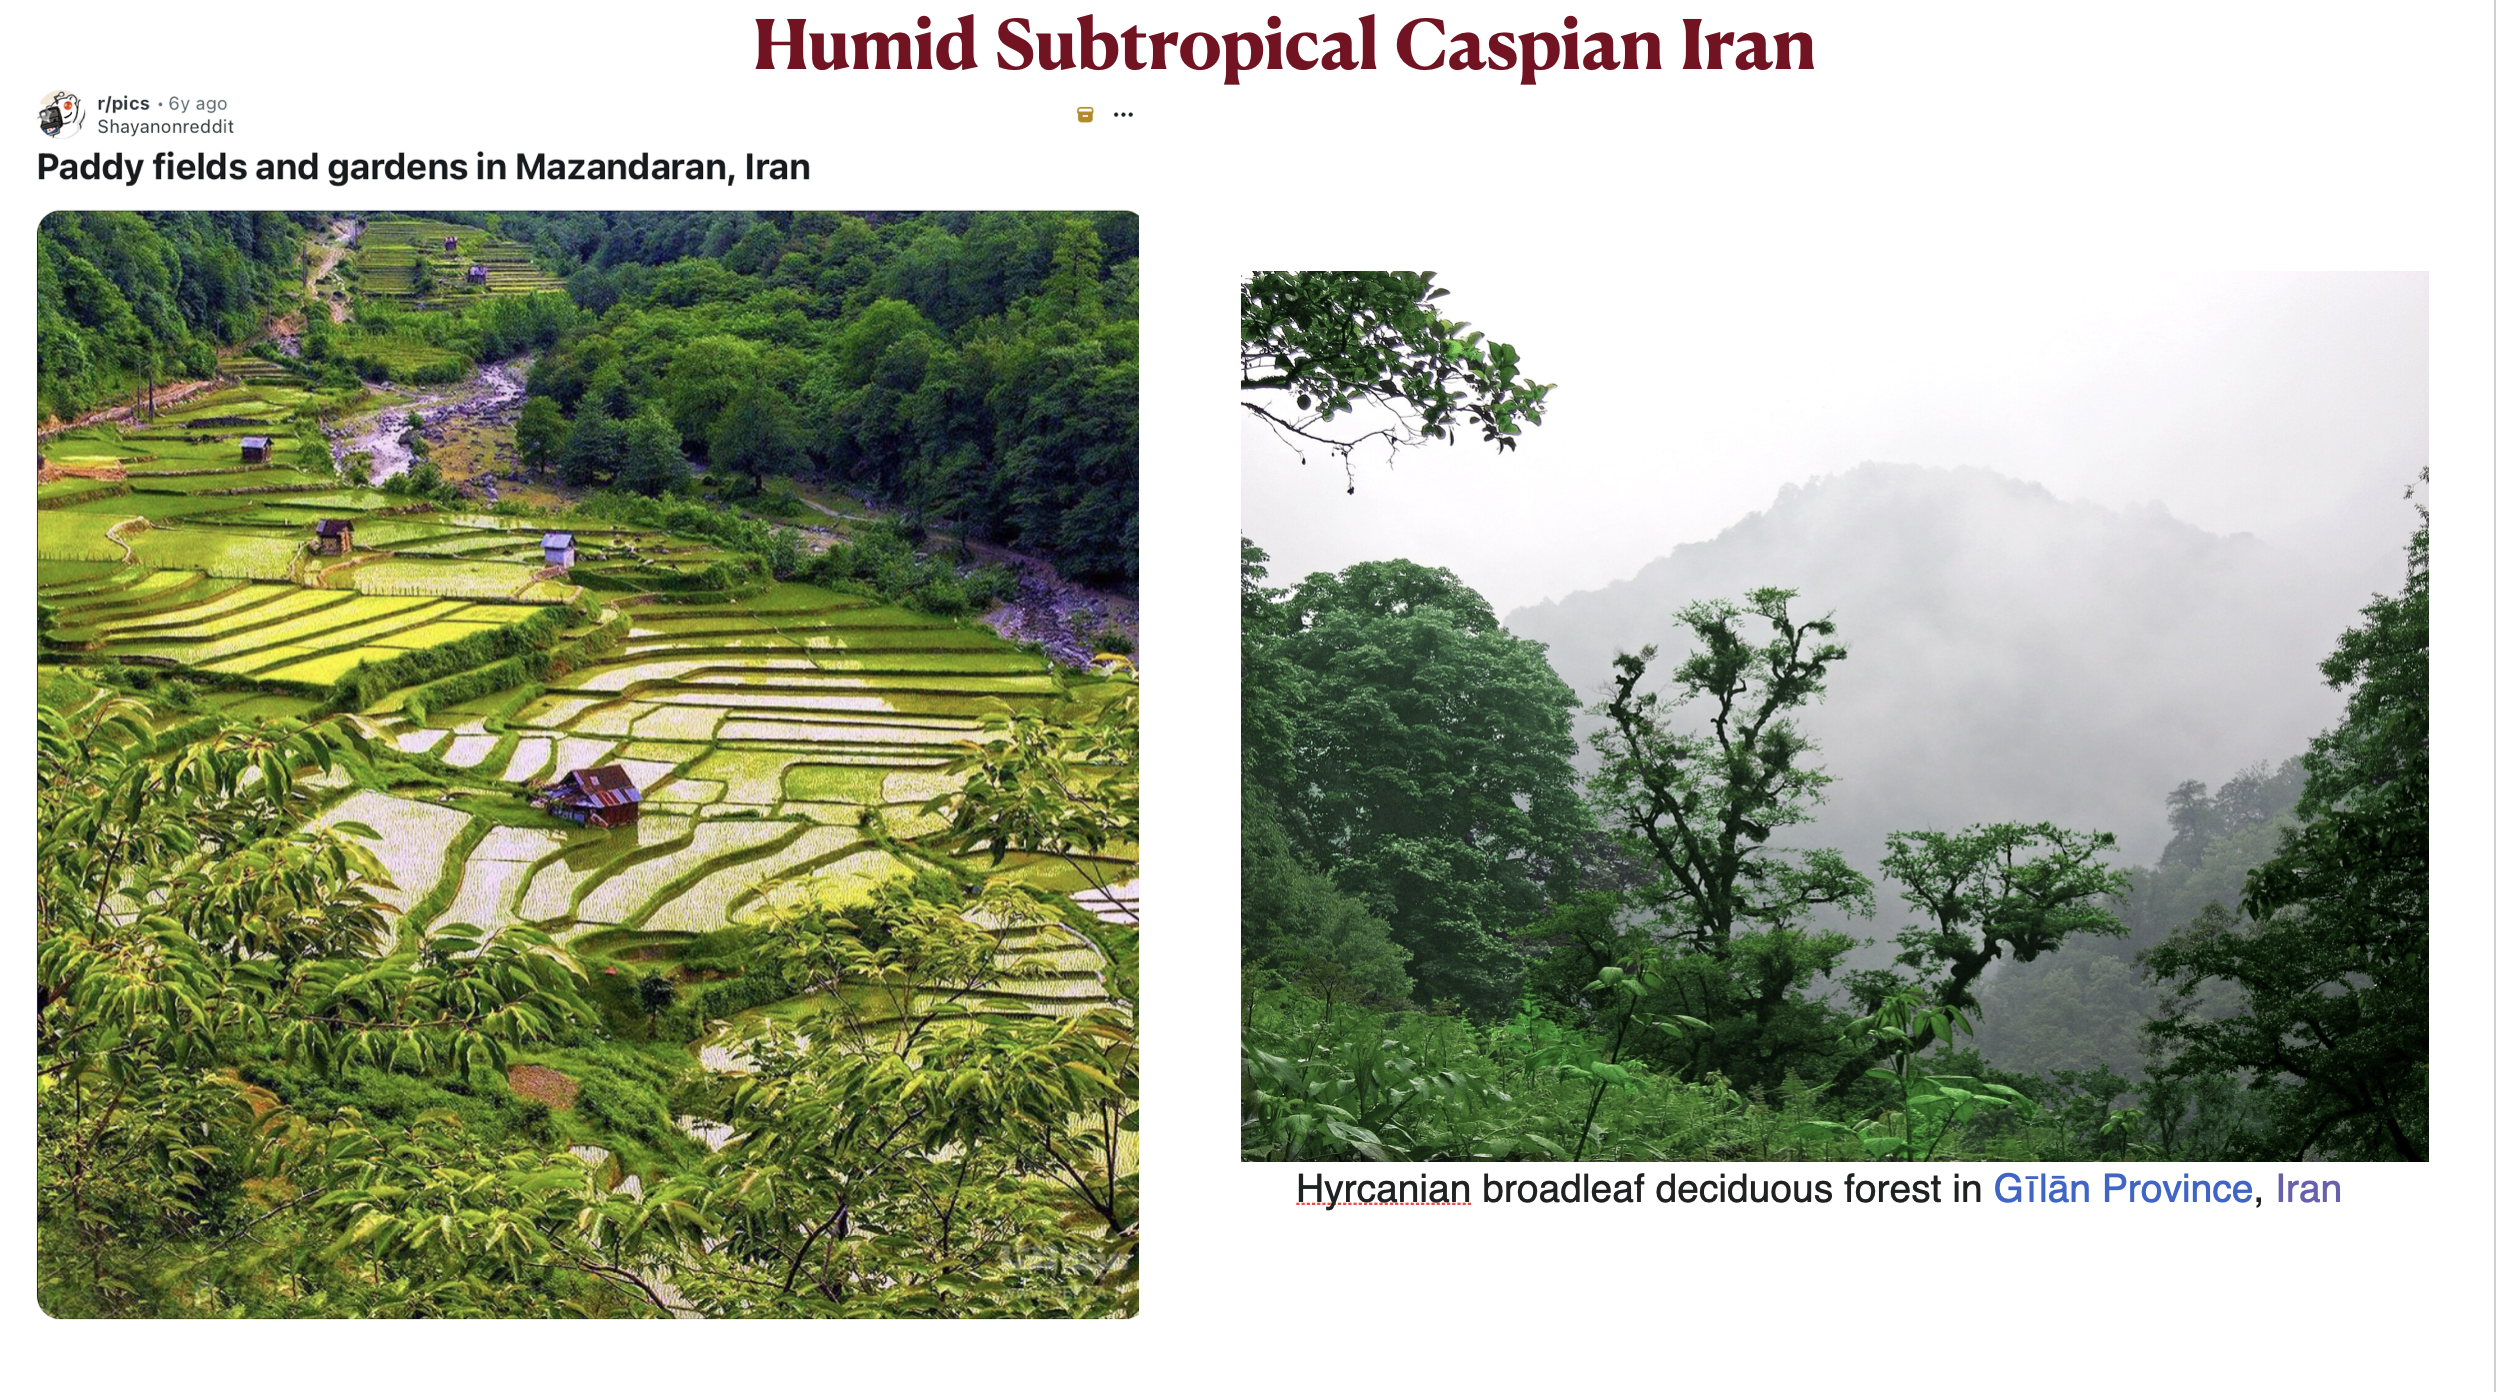
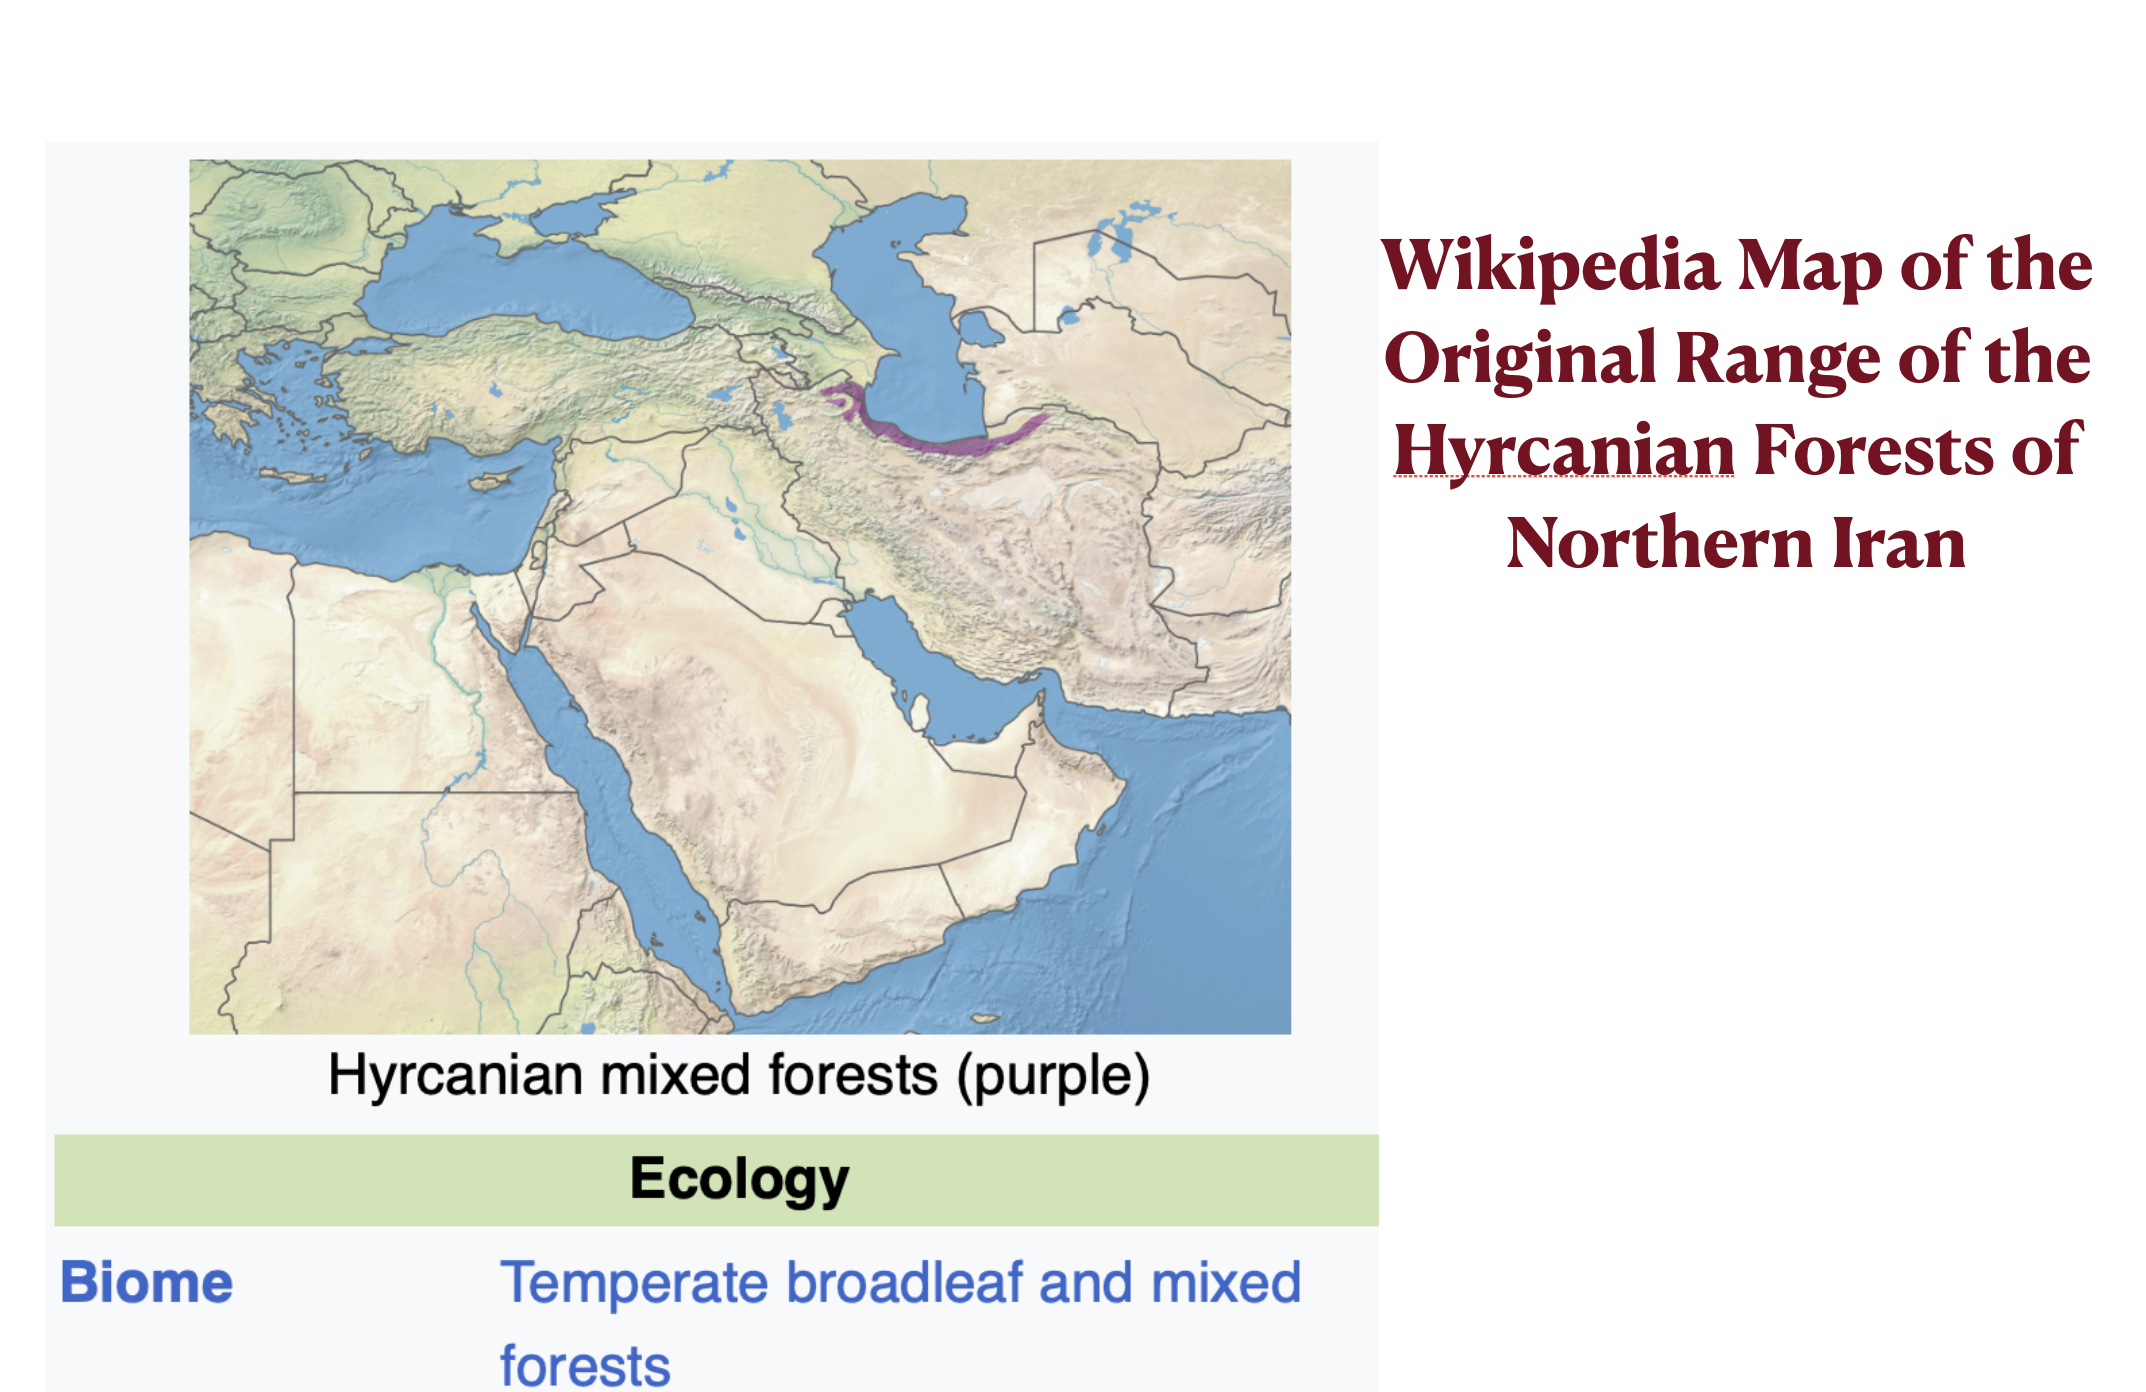
The Caspian region of Iran is highly distinctive and linguistically diverse. Mazandaran has its own language, Mazandarani, which is related to Farsi but far from interintelligible with it. The Caspian coastal plain is densely populated, with the highest rural population density in Iran by a wide margin. Mazandaran province has no large cities, but it does have a well-developed network of medium-sized urban centers. The Caspian region also has a highly productive agricultural economy, focused on rice, citrus and other fruits, vegetables, tea, and aquiculture. Much of this production is only possible because this region, quite unlike the rest of Iran, has a humid subtropical climate. Most of its mountainous areas are covered by lush, broadleaved forests. Until the 1950s, Caspian tigers lived in this region, and leopards still do.
Iran Population Density Map
Iran Rural Population Density Map
Humid Subtropical Caspian Iran
Humid Subtropical Forests of Iran Map
Iran’s Caspian region also has a distinctive political history. It resisted conquest by the Umayyad Caliphate and did not come under Muslim rule until 760 CE/AD, more than a century after the rest of Iran. According to the Wikipedia article on “Tabaristan” (the historical name of Mazandaran):
For a certain period, the Caspian shore of Iran served as a center for ancient Iranian national consciousness. In 783, during a rebellion in Tabaristan, the locals gave up their Arab husbands to the rebels. Dynasties such as the Bavandids and Ziyarids continued to commemorate their pre-Islamic background, with traditional Iranian festivals such as Nowruz and [Zoroastrian] Mehregan continuing to exist in Tabaristan
Long after Islamization, moreover, the Caspian generally remained partly or entirely autonomous, as well as culturally distinctive and sophisticated. The Wikipedia article on Tabaristan also notes that:
The writing tradition of the [Mazandarani] language is approximately as old as that of New Persian. This was due to the long-lasting independent and semi-independent local kingdoms, ruled by the ispahbads
But despite its profound cultural, historical, and environmental differences from the rest of Iran, the Caspian region is still part of the larger core region of the country. Its people consider themselves, and considered by others, to be an integral part of the Iranian nation. Iran’s powerful sense of national identity, in other words, is by no means limited to the Farsi- or Persian-speaking population, as it transcends most language boundaries in the country. The Azeri region of northwestern Iran is also tightly integrated with the Iranian national project, as we will see in the next post.
The previous GeoCurrents post examined critical rankings of the best Bob Dylan songs, which I graphed in terms of Dylan’s age when he wrote the songs in question. In this last of three posts on Dylan, the same technique is used for other rankings of his songs.
The first graph depicts Dylan’s song that have been most-often covered by other musicians, according, that is, to the fallible AI service, ChatGPT. As I contemplated making the graph, I thought that it might take a distinctive shape. That idea was based largely on the prominence of a single song, “Make You Feel My Love,” written relatively late in Dylan’s career (1997). As noted by Wikipedia, “[‘Make You Feel My Love’] is one of the few songs to have achieved the status of becoming a ‘standard’ in the 21st century, having been covered by more than 450 different artists.” The song, however, is not rated as one of Dylan’s best by any of the sources that I had previously consulted. It is, moreover, only the thirteenth most-covered Dylan song – and the only one written after 1973 (according ChatGPT). Overall, the graph of Dylan’s most-covered songs is similar to those based on critical assessments, examined in the previous post. The actual song selection, however, is somewhat distinctive, in that “Forever Young” and “Knockin’ on Heaven’s Door,” both written in 1973, have been covered more often than such critically acclaimed songs as “Tangled Up in Blue,” and “Visions of Johanna.”
Most-Covered Dylan Songs by Year graph
The next figure graphs the favorite Dylan song of some 80 musicians, selected by Stereogum to make such a choice in honor of Bob’s 80th birthday. Again, we see the familiar shape: an early peak followed by a drop then a resurgence, ending with a long tail as Dylan has aged. This graph does, however, have two distinctive features. First, it shows a relatively modest decline in Dylan’s late twenties. The second difference is a surprisingly large number of favorites written when Dylan was in his late seventies. This final peak derives largely from a single song, the almost 17-minute-long “Murder Most Foul.”
Musicians’ Favorite Dylan Song by Year graph
I could not resist graphing my own favorite Dylan songs for the final figure. I am unqualified to make such a list, and I would never claim that it represents anything like his “best” works – such an assessment, in my view, is one that only Dylan himself is qualified to make. At any rate, I found it relatively easy to pick my five favorite songs, but after that the process became increasingly difficult. I anticipated that the resulting graph would also have an unusual shape, as I tend to like the songs that Dylan wrote in the late 1970s and early 1980s more than most critics do. As it turned out, however, my graph follows the familiar curve, albeit with a larger-than-usual hump lasting from the early 1970s through the early 1980s. The fifty songs that I selected for graphing are listed in a figure at the end of this post.
GeoCurrents’ Favorite Dylan Songs by Year Graph
For what it’s worth, my top Dylan songs are: “Where Are You Tonight (Journey Through Dark Heat”) (1978); “Tangled Up in Blue” (1974); “Blind Willie McTell” (1983); “Like a Rolling Stone” (1966); and “Every Grain of Sand” (1980”). “Tangled Up in Blue” and “Lke a Rolling Stone” rank high on almost every list of the best Dylan songs, and both “Every Grain” and “Blind Willie McTell” appear in high positions on many. But my favorite Dylan song – indeed, my favorite song – rarely makes the cut. It does appear in The Rolling Stone’s 100-song list, but only in the 97th slot. I was therefore pleased to see that one noted musician, Craig Finn of The Hold Steady, picked this gripping and intensely emotional song as his favorite. As he writes:
Today my favorite Dylan track is “Where Are You Tonight (Journey Through Dark Heat).” The closing track on Street-Legal begins with funky percussion before sliding into an easy groove. And it is this part that I love especially — the comfort and confidence of Dylan already deep in an astonishing career fronting a band with this knowing soulfulness. I’ve been listening to this song for many years, and I still don’t know what it’s exactly about, but it seems to mix the modern and personal with the ancient and biblical. Thus it comes off as a piece about all of it, a sweeping arm gesture at everything from birth to potential afterlife, shooting off as spokes and paths from the trailhead of a seemingly benign beginning couplet: “There’s a long distance train/ Rolling through the rain.” And while the parenthetical “Journey Through Dark Heat” comes closest to capturing the essence of the song, the main title and refrain asks one of this life’s most pertinent and important questions to listeners, lovers, friends, and fellow humans: “Where Are You Tonight?”
The album on which this song appears, Street-Legal, is also one of my favorites, even though it was generally panned by critics when it was released. More recently, however, the album been rising in critical assessment; in 2019, for example, Nick Tavares wrote about the “blinding, belated brilliance of Bob Dylan’s Street-Legal.” In my own (unqualified) opinion, Dylan reached his peak in the three-album sequence issued from 1975 to 1978: Blood on the Tracks, Desire, and Street-Legal. This run would have been even better if the distasteful song “Joey” been dropped from Desire and replaced with the sublime “Abandoned Love,” which had been recorded for the album but was not included on it. (The rejection of “Blind Willie McTell” from Infidels is even more baffling.)
As a final note, I value many of Dylan’s evangelical songs, written when he was in his late thirties and early forties, more than most of his fans and critics. For this stage of his career, I often prefer covers, a preference that many of Dylan’s most devoted fans would view as anathema. For what it’s worth, I favor Liz Wright’s rendition of “Another Grain of Sand,” Elkie Brooks’ version of “The Groom’s Still Waiting at the Alter,” and Sinéad O’Connor’s take on “I Believe in You.”
In a recent lecture on declining birthrates, I mentioned pronatalist worries about a corresponding decline in our ability to solve problems and address crises, due mainly to the aging of the population. Creative thinking, according to this argument, is primarily an attribute of youth. Most environmentalists find this thesis unconvincing if not absurd. Creativity, they contend, is not limited to youth, and that even if it were, there will still be enough young creative minds even in countries with the lowest birthrates.
The idea that an aging society might be hobbled by a decline of creativity and vigor is not a fringe position, nor is it restricted to conservative pronatalists. Consider, for example, this recent passage from liberal New York Times columnist Nicholas Kristof:
In an aging and perhaps enfeebled world, Africa will also be a continent of youth — arguably making it comparatively vigorous and more of a hotbed for entrepreneurship and for music and popular culture. In a sign of increasing cultural influence, Africans in recent years have won both the Booker Prize and the Nobel Prize in Literature.
The scientific literature on age and creativity is large but no definitive answers have been reached. Some evidence suggests that creativity tends to decline with age in some domains but not in others. In fields in which raw mental power, along with the ability to think outside of established frameworks, are essential, breakthroughs often come early. Mathematics and physics are prime examples: Issac Newton developed calculus in his early and mid-twenties; Alfred Einstein was 26 when he wrote four groundbreaking papers, one of which established special relativity. In contrast, in fields in which the accumulation of knowledge and the honing of judgement are crucial, such as history and literature, age can be an advantage. This distinction is sometimes framed in terms of the difference between “fluid intelligence” and “crystalized intelligence.”
Songwriting is an intriguing area for musing on this question, as it combines the distinctive domains of musical composition and poetry. Poetry might seem to be good example of a field in which experience can be beneficial, but a vast trove of acclaimed poetry has been composed by the young. (John Keats died at 26, Percy Shelley at 29, and even Lord Byron made it only to 36.) Musical composition, in contrast, might seem favor the young, but some of the world’s most celebrated composers retained their powers into advanced age, including Johann Sebastian Bach, Ludwig van Beethoven, and Giuseppe Verdi. All told, one might expect some decline in creativity among songwriters. But – yet again – examples to the contrary are not hard to find. Leonard Cohen recorded his most beloved song, “Halleluiah,” in his late 40s, and his three final and widely celebrated albums were produced when he was in his late seventies and early eighties.
Yet when I casually consider the works of songwriters who came to fame in the 1960s and ‘70s and remained active for decades, most seem to have experienced some dimming of their creative spark as they aged. At 82, Paul McCartney continues to produce quality work, and he recently announced that he been “working on a lot of songs” that he hopes to finish and record in 2025. But I doubt that many critics would claim that his post-Beatles output, produced over 54 years, shows more creativity than the songs that he recorded with the Beatles over an eight-year period. (McCartney did, of course, share songwriting credit with the equally brilliant John Lennon in his early and mid-twenties, but most of the Beatles songs that he sang were essentially of his own creation.) As creativity declines, moreover, songwriting effort seems to increase. If I recall correctly, Paul Simon once said that in his youth songs simply poured out, whereas the older he became, the harder he had to work.
Bob Dylan makes an excellent case to consider the relationship between age and songwriting creativity. Dylan is widely regarded as the greatest songwriter of our time – if not of all time – and his output is vast (over 600 songs). He has worked in many genres yet is highly distinctive. He also continues to receive critical acclaim for his new songs. In 2021, 80 relatively well-known musicians were asked to name their favorite Dylan song to honor his 80th birthday, and five picked something from his 2020 album, Rough and Rowdy Ways. But as creative as he still is, I do see a descent over time. I also think that most critics and fans would agree.
This hypothesis might be testable, and least to some minimal degree. Many assessments have been made of Dylan’s greatest songs, by critics and others. The songs that are so acclaimed might serve as a reasonable proxy for his creativity, allowing one to graph his best output against his age (see the figures posted below).
Although the sources that I consulted vary significantly in the songs that they selected, the general pattern is clear. Dylan – in the imaginations of those who assess him – peaked in his early and mid-twenties. (As Joan Baez memorably put it, he “burst on the scene already a legend.”) The ranking of his work then plummets when he reached his late twenties, only to rebounded in his early and mid-thirties. But according to the critical consensus, he would never regain his previous heights. By his 40s, according to most sources, Dylan was writing few if any great songs. Although many critics have opined that he “returned to form” in his mid-50s, few of his songs from that period – and beyond – make the lists of his best. The general consensus seems to be that Dylan’s output from his early and mid-twenties outweighs everything that came later.
To sum it up, most observers agree that Dylan has experienced creative decline with age. But it is equally important to note that the downward slope has not been even, and that he has remained an impressively creative songwriter to this day. Youth helps, it would seem, but other factor are always at play. Dylan’s artistic decline in his late twenties, for example, may have had less to do with a drop in creativity than with devotion to family life. Consider, for example, these sweet but unremarkable lyrics from “Sign in the Window” (1970):
Build me a cabin in Utah
Marry me a wife, catch rainbow trout
Have a bunch of kids who call me “Pa”
That must be what it’s all about
That must be what it’s all about
The first graph is derived from asking ChatGPT to list Dylan’s “best songs by critical consensus.” I start with AI because it tends to give a bland overarching view, derived from numerous sources. The list that it provided clearly shows the pattern that I described above, albeit without the “long tail” found among the more knowledgeable and perceptive critics. The next figure purportedly graphs the collective assessment of “Dylan fans.” The same pattern is seen, although in simplified form. Ditto for the next two graphs, each of which is limited to his ten best songs.
The next set of figures are derived from longer lists. That of ShortList is somewhat unusual in showing a clear peak in his mid-twenties, relatively little resurgence in his thirties, and a long tail as he aged. One37PM, in contrast, has Dylan peaking in his early twenties. American Songwriter does so as well, and includes only one song written after his mid-thirties. Music Grotto also has an attenuated tail, but does contain one recent song (“Murder Most Foul”). In contrast, Paste includes many songs written after 1980. It also shows a smaller-than-usual decline in his late twenties, and rates the work of his early and mid-thirties at a higher-than-average level.
Rolling Stone has the most comprehensive list, as is fitting for a publication named after one of Dylan’s most famous songs (“Like a Rolling Stone,” which it places in the top slot). The overall pattern that it depicts, however, is fairly typical. Rolling Stone does, however, include a higher percentage of songs written in the early 1980s than is usual, as this is generally seen as the low point in his career. (The songs in question are: “The Groom’s Still Waiting at the Altar” [1980]; “Someone’s Got a Hold of My Heart” [1983]; “Sweetheart Like You” [1983]; “Jokerman” [1983]; and “Blind Willie McTell” [1983].)
Dylan’s 1997 album Time Out of Mind is regarded by many critics as marking a significant reappearance of excellence after years of disappointing ventures. As the Wikipedia article on the album notes:
For many fans and critics, the album marked Dylan’s artistic comeback after he appeared to struggle with his musical identity throughout the 1980s … .Time Out of Mind is one of Dylan’s most acclaimed albums, and it went on to win three Grammy Awards including Album of the Year in 1998.
But while a few songs from Time Out of Mind appear on several of the longer lists graphed below, the period in which it was written does not really stand out on these figures. There may have been a “return to form,” but it was evidently nothing like the form that he had reached in his early and mid-twenties.
(Several clarifications must be said about the graphs posted below. First, the age categories are based on the year in which he wrote the song in question, not the year in which it was recorded or released. Songs on the celebrated album Blood of the Tracks are conventionally dated to 1975, but most were written in 1974. The time brackets that I employ, dividing the decades of Dylan’s career into three segments, are of unequal length: four years for the “early” portion of each 10-year span, and three years for the “mid” and “late” portions. (I think it is safe to assume that most of us regard persons aged 20, 21, 23, and 23, as being in their “early” twenties, with “mid-twenties” reserved for those aged 24, 25, and 26, and so on.) Also to note is the fact that breaks on the graph often fail to correspond with breaks in Dylan’s style. His early electric songs, such as “Subterranean Homesick Blues” and “Maggie’s Farm,” are graphed as being from his early twenties, as they were written in 1964 when he was 23, although they were released in 1965 and are associated with his mid-twenties phase, the origin of which is chronicled in the second half of the recent film, A Complete Unknown.)
ChatGPT List of Best Bob Dylan Songs Graphed by Dylan’s Age
StudyFinds List of Best Bob Dylan Songs Graphed by Dylan’s Age
UCR List of Best Bob Dylan Songs Graphed by Dylan’s Age
Singersroom List of Best Bob Dylan Songs Graphed by Dylan’s Age
ShortList List of Best Bob Dylan Songs Graphed by Dylan’s Age
One37PM List of Best Bob Dylan Songs Graphed by Dylan’s Age
American Songwriter of Best Bob Dylan Songs Graphed by Dylan’s Age
Music Grotto List of Best Bob Dylan Songs Graphed by Dylan’s Age
Paste List of Best Bob Dylan Songs Graphed by Dylan’s Age
Rolling Stone List of Best Bob Dylan Songs Graphed by Dylan’s Age
Watching the superb and sublimely acted recent film A Complete Unknown has inspired me to revisit the songs of Bob Dylan. In doing so, I have once again been impressed with his geographical vision, marked by effective invocations of place. His frequent use of place names in lyrics has even drawn cartographic attention, as can be seen in figure posted below. (Although impressive, the map does not seem to capture all the places that Dylan has mentioned in his songs; Ashtabula in northeastern Ohio, for example, is apparently missing.*)
Slate Map of Bob Dylan Songs
Dylan achieved fame as a songwriter in part by drawing on, and synthesizing, a remarkable range of musical traditions. Although he initially gained attention for folk music, the blues genre has arguably been a greater influence over the course of his career. The album that he was working on in the second half of the film signals as much in its title: Highway 61 Revisited. Highway 61 (officially, U.S. Route 61) is often known as the “Blues Highway,” as it wends its way through the land of the Delta Blues in the Inland Delta of northwestern Mississippi (not to be confused with the actual delta of the Mississippi River – the so-called Bird’s Foot Delta – in southern Louisiana). Significantly, Route 61, as it was originally constituted, stretched from New Orleans to Duluth, Minnesota, Dylan’s birthplace, and beyond. Its northern reaches are not far from Dylan’s hometown, the small mining city of Hibbing in the Mesabi Iron Range.
Highway 61 Blues Highway Map
Mississippi River Delta and Inland Delta Map
Intriguingly, Dylan implies a journey from one end of Highway 61 to the other in his acclaimed song “Tangled Up in Blue,” generally regarded as a fictionalized, semi-autobiographical account:
I had a job in the Great North woods
Working as a cook for a spell
But I never did like it all that much
And one day the axe just fell
So I drifted down to New Orleans
Where I was looking for to be employed
Working for a while on a fishing boat
Right outside of Delacroix
Dylan’s choice of Delacroix, a town of 48 residents (in 2000), is also intriguing. Locally called “The End of the World” (originally “El fin del Mundo”), Delacroix was originally settled by Isleños, Spanish-speaking people from the Canary Islands. It is also known for the annual blessing of its fishing fleet.
Delacroix End of the World
One of the early scenes in A Complete Unknown features Dylan singing his folk tribute to Woody Guthrie, “Song to Woody,” to Guthrie himself, mute and restricted to his bed, as well as to folk-icon Pete Seager. Although moving and effective, the scene itself is fictional. “Song to Woody” was one of the first original songs that Dylan recorded, but it is never ranked, to my knowledge, as one of his best. It is a different story, however, with his 1983 homage to Willie McTell, a Georgia-born practitioner of the Piedmont Blues, described in his Wikipedia article as “singing in a smooth and often laid-back tenor, which differed greatly from the harsher voices of many Delta bluesmen …” Although relatively little known, in large part because Dylan was unsatisfied with the recording and only released it years later on a “Bootleg” album, “Blind Willie McTell” is now regarded by many critics one of Dylan’s best songs. Greil Marcus goes so far as to rate it as his greatest recording, provided, that is, if the listener is in “the right mood.” I would unreservedly put it among his top five. As commentator michaelg4411 pithily summarizes it on a YouTube offering of the song, “Hundreds of years of American history distilled into a six-minute masterpiece. Stunning.”
* Mentioned in “You’re Gonna Make Me Lonesome When You Go”: “I’ll look for you old Honolulu, San Francisco, Ashtabula.”
Western Cape is South Africa’s most politically distinctive region by a wide margin. It is the only province that has never given majority support to the African National Congress (ANC). In 2024, it gave less than 20 percent of its vote to the ANC, awarding 53.4 percent to the centrist, non-racialist Democratic Alliance, which has long dominated the province. As the second map posted below shows, every municipality in Western Cape gave majority or plurality support to the DA in the 2024 national election, whereas only three municipalities in other provinces did the same. Western Cape’s political differentiation is so pronounced that it supports an active independence movement that sometimes polls above 50 percent.
South Africa 2024 DA Vote by Province Map
2024 South Africa Election Vote by Municipality Map
South Africa’s White community heavily supports the Democratic Alliance, favoring its non-racialist stance. Not surprisingly, Western Cape has South Africa’s largest percentage of White population by a significant margin. But at 16.4 percent, it is still relatively low and as such cannot account for the DA’s success in the province. Instead, most DA voters in Western Cape are members of the mixed-race, Afrikaans-speaking Coloured community. At 42 percent, the Coloured community forms a strong plurality of the population of Western Cape. But the figure is identical in neighboring Northern Cape (see the second map posted below), which gave only 20.9 percent of its vote to the Democratic Alliance and awarded plurality support to the ANC. As it turns out, the two provinces are quite distinctive in other regards. Western Cape has a more productive economy and a higher level of social development. Northern Cape also has a much smaller White population percentage than Western Cape (7.3, as opposed to 16.4) and a significantly larger Black population percentage (50, as opposed to 39).
South Africa White Population by Province Map
South Africa Coloured Population map
But racial identity is not the only factor in determining voting patterns, and none of South Africa’s racial communities votes monolithically. In the 2024 election, many Coloured voters swung to Patriotic Alliance, which was formed in 2013 to favor the interests of their community. As can be seen in the map posted below, Patriotic Alliance took a healthy 7.8 percent of the vote in Western Cape and 8.6 percent in Northern Cape. As its support comes mostly from the Coloured community, its vote-count elsewhere in the country ranged from small to negligible. Nationwide, it took 330,425 votes, a huge increase from the 6,660 votes it received in 2019.
South Africa 2024 Election Patriotic Alliance Vote Map
Wikipedia describes Patriotic Alliance (PA) as a rightwing party, as its name might suggest. But the same article notes that PA’s economic stance is generally centrist. Some of its social policies, moreover, including those on housing and healthcare, tilt to the left. It also aims to reduce South Africa’s wide wealth and income disparities, which is generally viewed as a left-leaning position. But Patriotic Alliance is skeptical of immigration, takes a hardline stance on corruption, wants to reinstate the death penalty, and favors more socially conservative policies. It has also expressed solidarity with Israel in its struggle with Hamas, which is not a popular stance in South Africa’s Black community. Critics of Patriotic Alliance accuse the party of “gangsterism,” noting that its two founders are convicted criminals and contending that party leaders have worked with criminal organizations in an effort to reduce violent crime. Patriotic Alliance leaders have also advocated using veterans of the former Cape Corps, which had been a Coloured military organization, to help control gang violence.
Overall, it is difficult to classify the political position of Patriotic Alliance. It is not alone in this regard. Over much of the world, parties that defy the traditional left/right division are gaining support. A good example is Germany’s new political party Bündnis Sahra Wagenknecht (BSW), which emerged from the far-left but now takes an anti-immigration, populist, and nationalist stance. In the 2024 European Parliamentary election in Germany, BSW took 6.2 percent of the vote, whereas Die Linke (The Left), the party from which it emerged, took only 2.7 percent. Political realignment seems to be rapidly gaining strength in many countries.
As noted in the previous GeoCurrents post, South Africa’s leading political party, the African National Congress (ANC), suffered major losses in the 2024 general election, although it still significantly outperformed all other parties. Today’s post briefly examines the geographical patterns of the ANC’s 2024 showing, looking for correlations with socio-economic and demographic variables.
ANC vote share 2024 South Africa Election
As comparing the map posted above with the first map posted below shows, at the provincial level the ANC won higher-than-average levels of support in regions with lower-than-average per capita GDP. It did best in Limpopo and Eastern Cape, the two provinces with the country’s lowest levels of economic output per person. Intriguingly, this pattern is not found with South Africa’s most leftist major party, the communist-oriented Economic Freedom Fighters (EFF). EFF’s vote-share was relatively evenly distributed across the country, although it fared poorly in the country’s two most electorally aberrant provinces, Western Cape and KwaZulu-Natal. Intriguingly, EFF had its highest vote share in North West Province, which has a relatively high level of per capita economic output.
South Africa Per Capita GDP 2022 Map
Vote of EEF South African General Election 2024 map
Per capita GDP, however, can be a misleading indicator, as it does not necessarily capture differences in basic economic wellbeing. The somewhat elevated GDP figure of South Africa’s North West province, for example, largely reflects its productive mining operations rather than its basic economy. In the more revealing Human Development Index (HDI), North West province falls into South Africa’s lowest category, along with Eastern Cape. In contrast, Western Cape has South Africa’s highest HDI figure – and also had the second lowest level of support for the ANC. At the local level as well, the more prosperous parts of the country tended to vote against the ANC and for its most important rival, the Democratic Alliance. This pattern also has a strong racial component, as we will see in a forthcoming post on the Democratic Alliance party.
South Africa HDI by Province 2021 Map
The African National Congress is closely associated with South Africa’s majority Black population, and unsurprisingly performed relatively poorly in the two provinces that are not demographically dominated by Blacks, Western Cape and Northern Cape. But the ANC’s performance was middling or poor in several provinces with large Black majorities, as can be seen by comparing the map posted below with the first map posted above. As was noted in the previous GeoCurrents article, ethnic politics help explain the ANC’s low level of support in KwaZulu-Natal.
South Africa Black Population by Province Map
By delving down below the province level, we can find an interesting correlation between the ANC’s 2024 vote strength and South Africa’s ethno-linguistic divisions. As the paired maps posted below show, the ANC did very well among two ethnic groups: the Xhosa of the south-central region and the Venda (Tshivenda speakers) of the far northeast. The Xhosa – the country’s second-largest ethnic group, after the Zulu – have long been closely aligned with the ANC. The high level of support among the Venda is linked to the fact that the ANC’s current leader, Cyril Ramaphosa, is of Venda ethnicity, although he has born and reared in Soweto, Johannesburg.
In South Africa’s general election of May 29, 2024, the ruling African National Congress (ANC) party received only 40 percent of the vote. This election marked a stunning reversal of the party’s fortune; in 2019 it took 57 percent of the vote, while in 1994, 1999, 2004, 2009, and 2014 it took over 60 percent. Economic problems, persistently high levels of crime, allegations of corruption, and growing opposition to immigration have turned many South Africans against the once-dominant party that brought an end to apartheid and successfully democratized the country.
Despite its relatively poor showing, the ANC still did much better than any other party. The centrist Democratic Alliance (DA) came in a distant second place, with only 21.8 percent of the vote. The previously third-ranking party, the far-left Economic Freedom Fighters (EFF), took less than 10 percent, losing five seats in the National Assembly. Several new parties gained seats, particularly the left-populist uMkhonto weSizwe (MK) party, founded by the disgraced former president and previous ANC leader, Jacob Zuma. Zuma’s MK party took a healthy 14.6 percent of the vote, gaining 58 of the 400 seats in the National Assembly.
The strong showing of the new leftwing MK party coupled with the losses experienced by the African National Congress seem to indicate a profound level of dissatisfaction with the relatively moderate economic policies of the ANC’s current leader, Cyril Ramaphosa. But a geographical analysis of the election reveals a more complicated situation. As the map posted below indicates, MK did not emerge as a new party with national appeal, but rather one whose support is largely limited to the Zulu population. It received 45 percent of the vote in the Zulu heartland (KwaZulu-Natal), 16.8 percent in Mpumalanga, which is 24 percent Zulu-speaking, and 9.8 percent in Gauteng (the country’s core province, containing Johannesburg), which is 23 percent Zulu-speaking. Otherwise, MK’s level of support ranged from small to negligible. Its poor showing among the country’s other ethnic groups is not surprising, as its ideology is based – according to Wikipedia – on “Zulu nationalism” and “Zulu interests.”
South Africa 2024 election MK vote map
uMkhonto weSizwe is not the only South African political party that represents Zulu interest. The long-established Zulu-nationalist Inkatha Freedom Party (IFP) did relatively well in the 2024 election, taking over 18 percent of the vote in KwaZulu-Natal and gaining three additional National Assembly seats, for a total of 17. A socially conservative, anti-communist organization, the Inkatha Freedom Party finds most of its support in the more traditional north-central region of KwaZulu-Natal, as the paired Wikipedia map posted below show. It performed particularly well in the municipality of Ulundi. The town of Ulundi was once the capital of the Zulu kingdom and later became the seat of the Bantustan (apartheid-era pseudo-country) of KwaZulu. In no other province did the Inkatha Freedom Party exceed one percent of the vote; in the western third of the country it received less than one tenth of one percent.
2024 South African Election IFP vote map
2024 South African Election KwaZulu-Natal Vote Map
The 2024 election results show that KwaZulu-Natal stands apart from the rest of South Africa, its voters more inclined to support parties that favor Zulu interest than those who focus on national issues. As the paired maps posted below show, the only municipalities in KwaZulu-Natal that did not give plurality support to one the two Zulu nationalist parties are demographically dominated by Xhosa speakers rather than Zulu speakers.
South Africa 2024 election KwaZulu-Natal vote map
But KwaZulu-Natal is not the only South African province that stands politically apart from the rest of the country. As the first map posted below shows, the African National Congress received a relatively low percentage of the vote in three provinces: KwaZulu-Natal, Western Cape, and Gauteng. Elsewhere, it took a majority or near-majority of the votes cast. As a result, I have divided South Africa into four electorally distinctive regions (see the final map below). Coming Geo-Currents posts will explore these patterns in greater detail.
Tobacco use is plummeting over most of the world. This decline is easily seen on a map showing the change in the percentage of the adult population that uses tobacco from 2000 to 2020. If the World Health Organization data used to make this map are accurate, only five reporting countries saw an increase in tobacco users during this period: Croatia, Jordan, Oman, Republic of Congo, and Indonesia. Several countries, most notably China and France, reported small drops. But most saw major declines; in Bolivia, the percentage of adult tobacco users went from 37.1 to 12.7.
Screenshot
The regional patterns found on this map are intriguing. Tobacco use declined sharply over most of Africa, which already had relatively low rates of consumption. The increase in the Republic of Congo is therefore anomalous. Most of Latin America also saw a major decline in tobacco use. The patterns in Europe are more mixed, with sharp drops characterizing the north but with more modest declines elsewhere – and a surprising increase in Croatia. Substantial drops are also evident in South Asia, particularly India. The same pattern is found in Southeast Asia, with the notable exception of Indonesia. In contrast, most of the Middle East and North Africa reported more modest declines, or, in the case of Jordan and Oman, small increases.
As the second map shows, many countries had high rates of tobacco use in 2000, with quite a few exceeding 50% of the adult population. Because tobacco consumption tends to be gender biased, in some countries substantial majorities of men were users at this time, Burma (Myanmar) most notably. South Asia also reported high rates of tobacco consumption a quarter century ago. Central and Eastern Europe was another area of widespread consumption, focused on the Balkans. Latin America reported more variable patterns, with low rates of use in Guatemala, Colombia, and Ecuador but with much higher rates in Chile and Cuba. In Africa the relatively high figure posted for Sierra Leone seems odd. Madagascar, a country of mixed African and Southeast Asian ancestry, intriguingly groups more with Southeast Asia than it does with Africa in regard to tobacco use.
Screenshot
As the third map shows, the regional patterns of tobacco use found in 2020 are roughly similar to those found on the map of 2000, albeit at lower levels almost across the board. Several countries stand out for their persistently high levels of consumption, including Indonesia, Papua New Guinea, Burma, and Greece.
Screenshot
In the year 1500, tobacco use was largely confined to the Western Hemisphere. In the Eastern Hemisphere, it was found only in Australia. Indigenous Australians over a large portion of the continent chewed the leaves of several plants in the Nicotiana genus, as well as those of a related nicotine-containing plant, Duboisia hopwoodii. These leaves, mixed with ash, are called pituri.
Screenshot
In the Western Hemisphere in 1500 tobacco use was ubiquitous, found almost everywhere except the high Arctic. Several species of the genus Nicotiana were widely cultivated and traded and served vital ritual, cultural, social, and even political functions. Some supposedly non-agricultural hunting and gathering societies grew tobacco, and others gathered wild tobacco leaves. The widely consumed species Nicotiana rusticawas noted for its potency, with up to nine times more nicotine than N. tabacum as well as hallucinogenic harmala alkaloids. As a result, N. rustica was often used by shamans for religious experiences. Tobacco was also widely employed for medical purposes by indigenous peoples of North and South America. Such practices persist in some communities to this day. Despite its dangers, tobacco does have analgesic properties and several other demonstrable medical uses.
The geography of tobacco will be further explored in several forthcoming GeoCurrents posts.
Although both tea and coffee are consumed over most of the world, there is little overlap in the lists of the top tea and coffee consuming countries. This pattern is easily seen on the map posted below, which shows the world’s 16 top tea and coffee consuming countries on a per capita basis. Only the Netherlands makes both lists.
Screenshot
The top tea consuming countries are more geographically dispersed than the top coffee consuming countries. High levels of coffee consumption are found primarily in Europe, particularly in the Nordic countries. Outside of Europe, only Brazil and Canada make the list, and only Canada ranks in the top 10 (coming in at 10th place). The United States occupies the 25th slot, a sharp drop from its position a century ago. In 1900, the U.S. took in roughly half the world’s coffee exports. Its coffee consumption peaked around 1945 and subsequently began a slow but steady decline until about 1995. This drop is usually attributed to the marked increase in soft-drink consumption.
High levels of tea consumption, unlike those of coffee, are geographically dispersed. Countries in the top-sixteen list are in Europe, the Middle East, South Asia, East Asia, Africa, Latin America, and Oceania. China – where tea drinking originated – ranks in the 21st position. Intriguingly several countries that were once noted for their coffee culture largely switched to tea, Turkey most prominently. After World War I, the new Turkish Republic encouraged tea growing and drinking, partly to reduce imports. Coffee, unlike tea, cannot be grown in the country.
At the dawn of the early modern era five hundred years ago, tea and coffee were regional drinks. Both beverages subsequently underwent globalization, a process that accelerated in the mid-17th century. The two maps posted below show the approximate areas of tea and coffee origination, as well as the main areas of consumption around the year 1500. As it is difficult to find reliable information for many areas, these maps should be regarded as provisional approximations.
Screenshot
Screenshot
The main cultivation zones of both tea and coffee have also experienced profound shifts over the centuries. The final map shows some of the major geographical changes in coffee production. Initially, wild beans were gathered in the southern highlands of Ethiopia. By 1500, coffee growing was well established in the highlands of Yemen across the Red Sea. Problems with supply prompted European imperial powers to establish coffee plantations in their own domains by the early 1700s. Slave-grown coffee from the Caribbean, particularly Haiti, came to dominate the export market. After the successful Haitian rebellion (1791-1804), the main area of coffee production shifted to Asia, particularly to the British-controlled island of Sri Lanka and the Dutch-controlled island of Java. The fungal disease called coffee leaf rust, however, devastated Asian coffee plantations after 1860. Most were abandoned, with plantation owners in in Sri Lanka quickly switching to tea. The main coffee-production zone then shifted to Latin America, which long remained free of rust. By 1900, roughly 75% of the world’s coffee crop was grown in Brazil. But although Brazil remained the global leader, by the 1920s superior coffee was being produced in Colombia and Central America. Meanwhile, extensive coffee cultivation returned to Asia with the introduction of hardier but lower-quality robusta coffee (Coffea canephora). After reunification, Vietnam emphasized coffee cultivation, and by 1999 surpassed Colombia to become the world’s second largest producer. Meanwhile, many other countries became significant growers and exporters. Ethiopia, coffee’s homeland, now ranks in the sixth position, following Brazil, Vietnam, Colombia, Indonesia, and Honduras.
Almost all data sources rank Turkey (Türkiye) as the world’s top tea-drinking country, and by a considerable margin. According to Wikipedia’s article on the subject, annual per capita tea consumption in Turley is 3.16 kg (6.96 lb), far overshadowing second-place Ireland’s 2.19 kg (4.83 lb). Yet according to a World Population Review article that lists 2024 tea consumption by country, the people of southern South America drink much more tea than those Turkey. Here the per capita tea consumption of Argentina is mapped as seven times greater than that of Turkey. What gives?
Screenshot
The answer to this seeming mystery is that the writers at World Population Review have confused yerba mate with tea. Although producing a caffeine-rich beverage superficially similar to tea, yerba mate (a species of holly; Ilex paraguariensis), has no relationship with tea (a species of camelia; Camellia sinensis). Evidently, mate is consumed in much greater quantities in mate-drinking cultures than tea in consumed in tea-drinking cultures.
Although yerba mate is now globalizing, consumption is still focused in four South American countries: Argentina, Uruguay, Paraguay, and Brazil. Maps of mate-drinking that highlight these countries are somewhat misleading, however, as most of Brazil falls outside the mate zone, as seen in the second map below. Consumption in Brazil is heavily concentrated in the far south, particular in the state of Rio Grande do Sol. This pattern is not surprising, as Rio Grande do Sol was long contested by the Portuguese and Spanish colonial empires, and later by Brazil and its Spanish-speaking neighbors to the south. As a result, its culture has some affinities with those of Argentina, Uruguay, and Paraguay. In Brazil, the people of the state are often called gaúchos, which would be equivalent to calling Texans “cowboys.” Actual gaúchos tend to drink a lot of yerba mate, just as American cowboys have historically consumed a lot of coffee.
Screenshot
Screenshot
The people Rio Grande do Sol generally embrace their gaúcho designation. As Ruben George Oliven explains in a 2006 Nations and Nationalism article:
From the 1930s, Brazil experienced a growing national centralisation and the construction of Brasilidade (Brazilianness). The military regime (1964–85) deepened centralisation and emphasised national identity, little space being left for regional identities. With the political opening and the redemocratisation of Brazil, starting at the end of the 1970s, the stress was on differences in a period in which Brazil had already achieved a high degree of integration. Identities were re-created, among them that of Rio Grande do Sul, the southernmost state of Brazil, where a strong revival of gaúcho culture took place. The 1980s and 1990s were marked by a growing development of activities and disputes linked to the gaúcho tradition. In spite of the fact that Rio Grande do Sul is predominantly urban and industrialised, this process reached out to the state’s rural past and the equestrian figure of the gaúcho.
Intriguingly, the world’s three main hot, caffeinated drinks – coffee, tea, and mate – all have religious roots. Coffee was popularized in Yemen by Sufi mystics who found it useful for keeping awake during all-night chanting sessions. Tea was first popularized in China by Buddhist monks who found it useful for keeping awake during all-night meditation sessions. The story of mate is different, but it too has religious aspects. In pre-colonial times, mate consumption was evidently limited to two relatively small subgroups of the Guaraní people. The Jesuits subsequently united the Guaraní people of Paraguay under a theocratic state. They encouraged mate consumption and effectively domesticated the plant. Mate eventually became the national beverage of Paraguay, and later expanded into Argentina, Uruguay, and southern Brazil.
Yeba mate is closely related to another caffeine plant, Yaupon, which grows in the southeastern lowlands of the United States. Indigenous peoples drank Yaupon tea, sometimes to excess. The plant’s scientific name, Ilex vomitoria, “comes from an observation by early Europeans that the ingestion of the plant was followed by vomiting in certain ceremonies[;]… the vomiting may have resulted from the great quantities in which they drank the beverage, coupled with fasting.” Such a fasting and (caffeine-) feasting regime also probably had spiritual roots.
Screenshot
Yaupon is now undergoing something of a comeback in the U.S., grown by people who want a “healthy coffee alternative” and who value its beauty and the food that it provides for wildlife. As Lily Anderson Messec writes:
Pollinators flock to its masses of tiny white flowers in spring, and birds eat the berries that follow the flowers. Most importantly, our native insects feed on these plants they have evolved with, providing protein rich meals (in the form of themselves) for birds and other wildlife.
The wildlife, however, are not the only ones eating it. The prime reason I planted my Yaupon was for its caffeine rich leaves. By weight, the leaves contain more caffeine than both coffee beans and green tea —the highest caffeine content of any plant native to North America. Yaupon holly is also high in antioxidants and less bitter than green tea. It is a close cousin of the South American yerba maté (Ilex paraguariensis) and its tea is similar in flavor and quality.
Maps of alcohol consumption in the United States reveal several regions with very low drinking rates. The most prominent is the LDS (Mormon) cultural region focused on Utah and eastern Idaho. The so-called Bible Belt of the southeastern and south-central states is also clearly visible, although most of its coastal counties are excluded. More surprising are several heavily Native American counties in the northern Great Plains and Southwest. Many tribal governments restrict alcohol sales, but actual consumption rates may be higher than the map indicates. Comparing the maps posted here, several indigenous-dominated counties in South Dakota are shown as having low rates of alcohol drinking but relatively high rates of heaving drinking.
Screenshot
Screenshot
In general, high rates of adherence to religious demoninations that oppose alcohol consumption are associated with low rates of drinking. Lyman Stone, in a fantastic, map-rich post called “Mapping American Churches,” makes this point by juxtaposing a map of “anti-alcohol religious attendance rate” with one showing the prevalence of heavy drinking. As he bluntly notes, “Turns out religious opposition to drinking reduces drinking. Surprise.”
Screenshot
But although this correlation is striking if unsurprising, interesting – and surprising – exceptions can be found. The most prominent is the central Appalachian region, focused on West Virginia. West Virginia reports very low rates of alcohol consumption and abuse – lower than those of any other state except Utah according to some sources. Yet West Virginia has only a middling level of membership in anti-alcohol churches. It also has a very low rate of overall religious adherence (according to data from 2000).
Screenshot
Screenshot
Screenshot
Several explanations have been offered for West Virginia’s official rate of alcohol consumption. One is the state’s high level of opioid abuse, as revealed by a 2015 map of overdose deaths. Another is the prevalence of illicit and untaxed alcohol (“moonshine”) that escapes tabulation.
Screenshot
A 2019 article in the Exponent Telegram (Clarksburg, WV) expressed some doubt about the state’s reported level of alcohol use. While acknowledging that West Virginia “ranks the lowest in the nation for adult prevalence of both heavy drinking and binge drinking …[and] has been either the lowest or second lowest for many years,” the article went on to note that:
In the period from 2003 to 2012, the most recent data available, 1,092 people died in West Virginia due to crashes involving a driver with a blood alcohol content of 0.08 or higher. That rate, 12.9 per 100,000 population, is well above the national average rate of 6.7 for the same time period.
Although I doubt that West Virginia has one of the lowest alcohol-consumption rates in the United States, it would seem to be lower than one might expect given the state’s history, economic conditions, and relatively low rates of membership in anti-alcohol churches.
I am currently teaching a class for Stanford University’s Continuing Studies Program on the history and geography of natural psychoactive substances. Over the next nine weeks, I will be posting GeoCurrents articles derived from these lectures.
I have mapped the global distribution of each substance under consideration at the beginning of the early modern era (circa 1500). Creating these maps was tricky, and I cannot vouch for their accuracy. In many cases, the only information I was able to find was through ChatGPT. The responses that I received from the chatbot the were often too vague to be of much use. For example, when I asked, “Did the indigenous peoples of the Bismarck Archipelago have alcohol?” ChatGPT told me that “The indigenous peoples of the Bismarck Archipelago, located in the western Pacific Ocean, did not have traditional alcoholic beverages in the same way as some other cultures did. Alcohol consumption in these communities was not widespread before the arrival of European colonial powers.” I also know from experience that ChatGPT sometimes provides nonsensical answers, and a few of its responses to my alcohol-distribution questions are contradicted by other sources. As a result, these maps must be taken with a grain of salt. Note that I have put question marks in areas where the information that I found is conflicting.
Screenshot
The first map in this series, posted above, shows the distribution of alcohol (ethanol) consumption circa 1500 CE. Alcohol was at the time the world’s most widely distributed psychoactive substance used for “recreational” purposes. It was known almost everywhere in Africa and Eurasia. Much of the Eurasian Arctic, however, was an exception owing largely to its lack of fermentable substances. Alcohol was not traditionally consumed over most of the Pacific. Some coastal populations in New Guinea made alcoholic beverages from abundant and easily fermented palm sap, but ethanol was apparently not known in the more densely populated central highlands. In Polynesia and most of Micronesia and Melanesia, alcohol was unknown, but kava (Piper methysticum) served a similar function in many areas.
Alcohol was widely used almost everywhere in South America and Mesoamerica. This “drinking zone” extended into some parts of what is now the southwestern United States, particularly among the so-called Pueblo Indians. Over the rest of North America, however, ethanol consumption was either unknown or very rare. There are reports that indigenous groups in what is now the southeastern United States sometimes made alcohol and some sources claim that Iroquoian peoples in the northeast fermented maple syrup. Overall, however, it is something of a mystery why alcohol was either unknown or little-used over most of North America.
Although alcohol was the most widely used psychoactive substance at the beginning of the early modern era, it was also subjected to the most widespread prohibitions, as the second map shows. In the Islamic world, alcohol was religiously prohibited, although some lax interpretations of the Quran held that only the consumption of wine was banned. And even though wine was forbidden in all interpretations of Islamic law, it was still widely consumed, especially in the Persian-speaking region. In the Hindu communities of India, traditional prohibitions of alcohol were largely based on caste membership. In general, high-caste Brahmins (“priests”) and Vaishyas (“merchants”) were not permitted to drink, although high-caste Kshatriyas (“warriors” and “rulers”) were. Low-ranking Dalits (“untouchables”) could drink. Customs varied among the middling Shudra groups, although the general rule was that a rejection of alcohol enhanced a group’s purity. Alcohol consumption was strongly discouraged by Theravada Buddhism, the dominant sect of Buddhism in Sri Lanka, Burma, Thailand, Laos, and Cambodia. Ethanol was certainly consumed in these lands in the early modern period, but a degree of stigma surrounded its use.
Screenshot
It is intriguing that the zone of widespread alcohol prohibition is essentially located in the center of the region of historical alcohol consumption. Although Egypt and Iraq today have very low drinking rates, in ancient times alcohol had important religious implications in both lands. In Sumer (southern Iraq), usually regarded as the world’s first civilization, beer was viewed as an essential attribute of civilization. In Gilgamesh, the world’s first epic, the wild man Enkidu was domesticated by, among other things, the consumption of beer.
Screenshot
Screenshot
Sumerian beer was so thick and porridge-like that it had to be consumed through special straws that could filter out the solids, as is seen on many images from the era. Today, curious brewers are reproducing Sumerian beer and drinking it in the same manner.
In the United States, fertility rates increasingly correlate with religiosity. Those who regularly attend religious services have more children than those who irregularly attend, who, in turn, have more than nonreligious people (see the graph below). Does this generalization hold for South Korea, a predominantly secular country with substantial Christian and Buddhist minorities? (A 2021 Gallup Korea poll found that 60 percent of South Koreans have no religion, with 16 percent following Mahayana Buddhism, 17 percent Protestant Christianity, 6 percent Roman Catholic Christianity, and 1 percent other religions.) Apparently, it does so only to a slight degree. According to a study published in Demographic Research in 2021, the Total Fertility Rate by faith in South Korea in 2015 was as follows: no religion, 1.13; Buddhist, 1.33; Catholic, 1.16; Protestant, 1.28; and “other religion,” 1.20.
A number of scholars, however, have linked South Korea’s ultra-low fertility rate to Confucianism, a largely secular philosophical system with religious undertones. In the Joseon period (1393-1894), Confucianism was the dominant belief system of the Korean elite. Confucian ideas and practices still pervade South Korean society, probably to a greater extent than any other country. Intriguingly, other countries of Confucian heritage also have low (North Korea, Vietnam) or ultra-low (Japan, China, Taiwan) fertility levels (although that of Vietnam is just under replacement level and is currently holding steady). Japan and China are also, like South Korea, afflicted with high rates of withdrawal from marriage and the work-force by disaffected young people, a phenomenon known in China as the “lying flat” movement (tang ping).
Scholars who have posited a link between Confucianism and ultra-low fertility in South Korea have generally focused on women, highlighting the increasing numbers of whom are intentionally foregoing marriage and childbearing. Standard Confucianism is decidedly patriarchal, with wives placed in a subservient position to their husbands. Family solidarity is highly valued, with mothers expected to devote themselves to their children. As a result, pursuing a career is often deemed incompatible with childbearing and rearing. Faced with such a dilemma, increasing numbers of young Korean women are choosing career development over marriage and motherhood.
In an interesting article called “Ultralow Fertility in East Asia: Confucianism and Its Discontents,” Yen-hsin Alice Cheng argues that the East Asia has a unique fertility regime characterized by male-skewed sex ratios at birth (due to son preference), low rates of non-marital birth, rising prevalence of bridal pregnancy, and low rates of cohabitation. These attributes, she argues, are “closely linked to a patriarchal structure based on family lineage through sons, strong parental authority, and emphasis on women’s chastity (i.e. sanctions for premarital sex and ‘illegitimate’ births outside of marriage) and the belief that women are obliged to bear sons to continue the patrilineal bloodline” (p. 98-99). Faced with such expectations, she argues, many young women are simply opting out.
Although the connection between low fertility and Confucian patriarchy has been made by many others, Cheng also links it to Confucian-inspired “credentialism.” Here she focuses on the legacy of the highly prestigious imperial civil service examinations that selected elite bureaucrats based on their exam performances. This heritage has resulted, she argues, in a “low regard for vocational education and craftsmanship in Confucian societies,” with “academic success in the educational system considered a life goal that is of paramount importance …, with parents doing their best to make sure their children advance as far as possible academically” (p. 102). Today, academic success translates into coveted positions in South Korea’s world-class corporations and allows entry into prestigious professions. Such jobs, however, are limited, relegating even some of the most diligent students to non-prestigious jobs that are regarded as humiliating. Faced with such pressures, many young people prefer social withdrawal.
Scholarly attitudes toward Confucianism in the West have oscillated from condemnation to commendation, depending in part on economic and political conditions in East Asia. In the eighteenth century, when Qing China was the world’s most powerful country, Enlightenment philosophers celebrated the rationalism, secularism, and meritocracy of Confucianism, marveling at a society in which elite status was determined more by exam performance than by aristocratic birth and in which the military was subservient to civil society. Some writers even claim that Confucius was the “patron saint of the Enlightenment.” But as China declined in the nineteenth century while the West advanced, attitudes changed. It eventually came to be argued that the inherent conservatism of Confucianism, marked by undue submission to authority and rigidly hierarchical lines of power, prevented innovation, adaptation, and modernization in East Asia. But the mindset shifted again in the second half of the twentieth century as Confucian societies underwent extraordinarily rapid economic growth and modernization. It then came to be argued that Confucianism’s profound respect for education propelled economic development while its emphasis on family cohesion ensured social stability. But now the tables are again turning, with Confucian patriarchy and credentialism blamed for South Korea’s demographic collapse and the concomitant crisis of disaffected young people abandoning social expectations and dropping out.
None of these interpretations are either “correct” or “incorrect,” and all probably contain an element of truth. A belief system as comprehensive as Confucianism has many different aspects and pulls in different directions. It influences social structures but does not determine them, and thus provides partial explanations at best. A significant amount of evidence, moreover, suggests that today’s supposedly Confucian-generated social pathologies are not limited to East Asia. Ultra-low fertility, for example, is found elsewhere, including much of Europe. But here too historically patriarchal social structures seem to play a role, as Europe’s more gender equalitarian societies now have higher fertility levels than those with traditionally stronger gender roles; compare, for example, the TFR charts of Sweden and Italy posted below.
The most important issue is probably the extent to which the social withdrawal phenomenon is unique to South Korea and other countries of Confucian heritage. Similar although less extreme developments do seem to be occurring in the United States and Europe, as is noted in the Wikipedia article on South Korea’s Sampo (“Giving Up”) Generation. Rates of depression, anxiety, and social isolation among young people in the U.S., moreover, are also surging. Although many explanations have been offered and debated, this phenomenon is complex and pervasive, leading some to suspect that modernity itself is the ultimate culprit. By this interpretation, modern societies are much better at generating goods and technologies than meaning and real social connections, yet meaning and real social connections remain essential for psychological health. Jon Haidt has been arguing for some time that social media, particularly Instagram and TikTok, are responsible for much of the mental-health crisis among American girls; he now argues that the much more gradual psychological decline found among boys began decades earlier with the arrival of computerized gaming, which pulled them out of real-world encounters and into simulated environments. In some regards, South Korea is the most technophilic and modernistic country in the world, and, by this reasoning, it would be expected to be at the leading edge of a modernity-generated social crisis.
The Netherlands is one of the most secular countries in the world. In a 2022 survey, 57 percent of its people reported “no religion,” 18 percent Catholicism, thirteen percent Protestant Christianity, and 5.6 percent Islam. Many of those who profess Christianity, moreover, are not very religious. In 2015, 82 percent of the Dutch population indicated that they “never or almost never” set foot in a church. But despite such widespread secularism, religion plays a significant role in Dutch politics. Three of the 15 parties in the country’s parliament officially signal their Christianity and another has roots in Christian democracy. Such a seeming discrepancy calls for further analysis.
Historically, the Dutch people were often noted for their religiosity. In the fourteenth and fifteenth centuries, they formed the core group of the influential Devotio Moderna movement that sought to revitalize Christianity through devotion to piety, humility, and simplicity of life. Learning was important as well, as exemplified by Erasmus of Rotterdam. In the mid-sixteenth century, conversion to Calvinism, or Reformed Christianity, was widespread, especially in Holland and Zeeland. This religious change helped spark rebellion against Spanish rule and the creation of the Dutch Republic in 1579. Although the Dutch Republic was noted for its religious toleration, it was closely associated with Calvinism, which continued to spread across its seven constituent provinces (Holland, Zeeland, Utrecht, Friesland, Groningen, Overijssel, and Gelderland). Territorial gains made with the Peace of Westphalia (1648) brought substantial Catholic territories into the republic, most notably in North Brabant, which were long ruled on a semi-colonial basis. As the intensity of Dutch Protestantism declined in the nineteenth century, religion conflict intensified, pitting Catholics, Calvinists, and post-Calvinists against each other. The main response was the “pillarization” of Dutch society, defined as the “the vertical separation of citizens into groups by religion and associated political beliefs.” By the beginning of the twentieth century, four main pillars had crystalized: Catholic, Protestant, Liberal, and Socialist. As Wikipedia notes:
Each pillar [had] its own social institutions and social organizations. These [included] its own newspapers, broadcasting organisations, political parties, trade unions, farmers’ associations, banks, stores, schools, hospitals, universities, scouting organisations and sports clubs. Such segregation [meant] that many people [had] little or no personal contact with members of other pillars. [Note: quotation edited to put it in the past tense.]
Depillarization began after World War II, but remnants persist, especially in education. The Netherland’s several Christian political parties might also be seen a holdover of the pillarization era, although some of their sectarian lines have blurred over time. The Christian Union party is rooted in the Reformed Church and thus takes a conservative stance on social matters, but it now leans to the left on economic and environmental issues, based on the Biblical precepts of charity and stewardship. The somewhat more conservative Christian Democratic Appeal originated in 1977 through the confederation of three religious-political groups, two Protestant and one Catholic. The third explicitly religious party, the Reformed Party (SGP), represents unreconstructed Calvinism and is decidedly rightwing. It is sometimes even regarded as advocating theocracy, although that allegation is controversial. SGP is the Netherland’s oldest political party, having been established in 1918. One of its founders envisioned a Netherlands “without cinema, sports, vaccination, and social security.” While the antipathy to sports has dissipated, opposition to playing games on Sundays has not.
Although religious affiliation has declined more sharply in the traditionally Protestant parts of the Netherlands than in the traditionally Catholic ones (see the first map below), intense religiosity is more common in the former region. The Old Reformed (strictly Calvinist) congregations have a membership of roughly 400,000, although some sources claim that over a million Dutch people remain affiliated with their version of the Reformed faith. Staunch believers are concentrated in a discontinuous “Bible Belt” that stretches from Zeeland in the southwest to the Netherlands’ center-north. It is often mapped based on support for the Christian Union and Reformed parties (see the map below). Intriguingly, the Dutch Bible Belt is located just north of the historical divide between the Protestant and Catholic parts of the country. This distribution pattern has been used as evidence that the Netherlands’ Bible Belt originated from Protestant stalwarts fleeing Catholic domination before the Peace of Westphalia in 1648, but this interpretation remains uncertain.
In the 2023 general election, the (Calvinist) Reformed Party had its best showing by a wide margin in Zeeland, where it took almost 10 percent of the vote. But it came in first place in only one of the Zeeland’s municipalities. Nationwide, it did so in eight of the 342 municipalities into which the Netherlands is divided. Rather than forming a contiguous belt, these municipalities are widely scattered. One lies in the country’s demographic core (Woudenberg in Utrecht Province) and another, Urk, is found in Flevoland, a land that did not even exist until it was diked and drained in the 1950s and ‘60s. As a new province, it might seem surprising the Flavoland would be home to such a traditional community. But Urk is an old fishing town that sat on an island before the massive drainage projects of the mid twentieth century. It is often regarded as the country’s most conservative municipality. Its politics have long been dominated by Christian parties, particularly the SGP and local offshoots, although in recent years the right-populist PVV and FvD have gained considerable support. The 21,000 residents of Urk have also maintained their own distinct dialect, usually called Urkers As noted in Wikipedia article on Urk:
One of the oldest and most distinctive dialects of Dutch is the language spoken in Urk. Nearly everyone in the village speaks this dialect and uses it in daily life. The dialect deviates considerably from contemporary standard Dutch and has preserved many old characteristics that disappeared from standard Dutch a long time ago. The Urkish dialect also includes elements that are older than standard Dutch and were never part of the standard language. … The dialect developed this way because until World War II, Urk was an island and could only be reached by boat. Radio was unknown, and the poor population did not have much money for newspapers and books. Until the modern era primary education for the children typically lasted only two years; afterwards children had to help maintain the family and formal schooling ended.
The deep conservatism of old-school Dutch Calvinism is politically reflected in places far from the Netherlands, most notably among the Afrikaners of South Africa. It can also be seen in the United States, particularly in a few counties in southwestern Michigan and northwestern Iowa that were heavily settled by Dutch immigrants. This correlation can be seen in the paired maps posted below, one showing the prevalence of the (Dutch) Reformed Church in Iowa and the other showing the results of the 2020 presidential election in the same state. Donald Trump is anything but a reflection of Calvinist values, but the overwhelming support that he received in northwestern Iowa does indicate an abiding hostility to liberalism and leftism in this region that has deep roots in the Dutch Reformed Church.
As a final note, it is intriguing that the centrist Christian Union party had by far its best showing in the 2023 general election in Bonaire and the two other special Dutch municipalities located in the Caribbean.